sl <- semaforos_get("long")
head(sl)
#>                estado year week color
#> 1      Aguascalientes 2020   22  rojo
#> 2     Baja California 2020   22  rojo
#> 3 Baja California Sur 2020   22  rojo
#> 4            Campeche 2020   22  rojo
#> 5             Chiapas 2020   22  rojo
#> 6           Chihuahua 2020   22  rojo
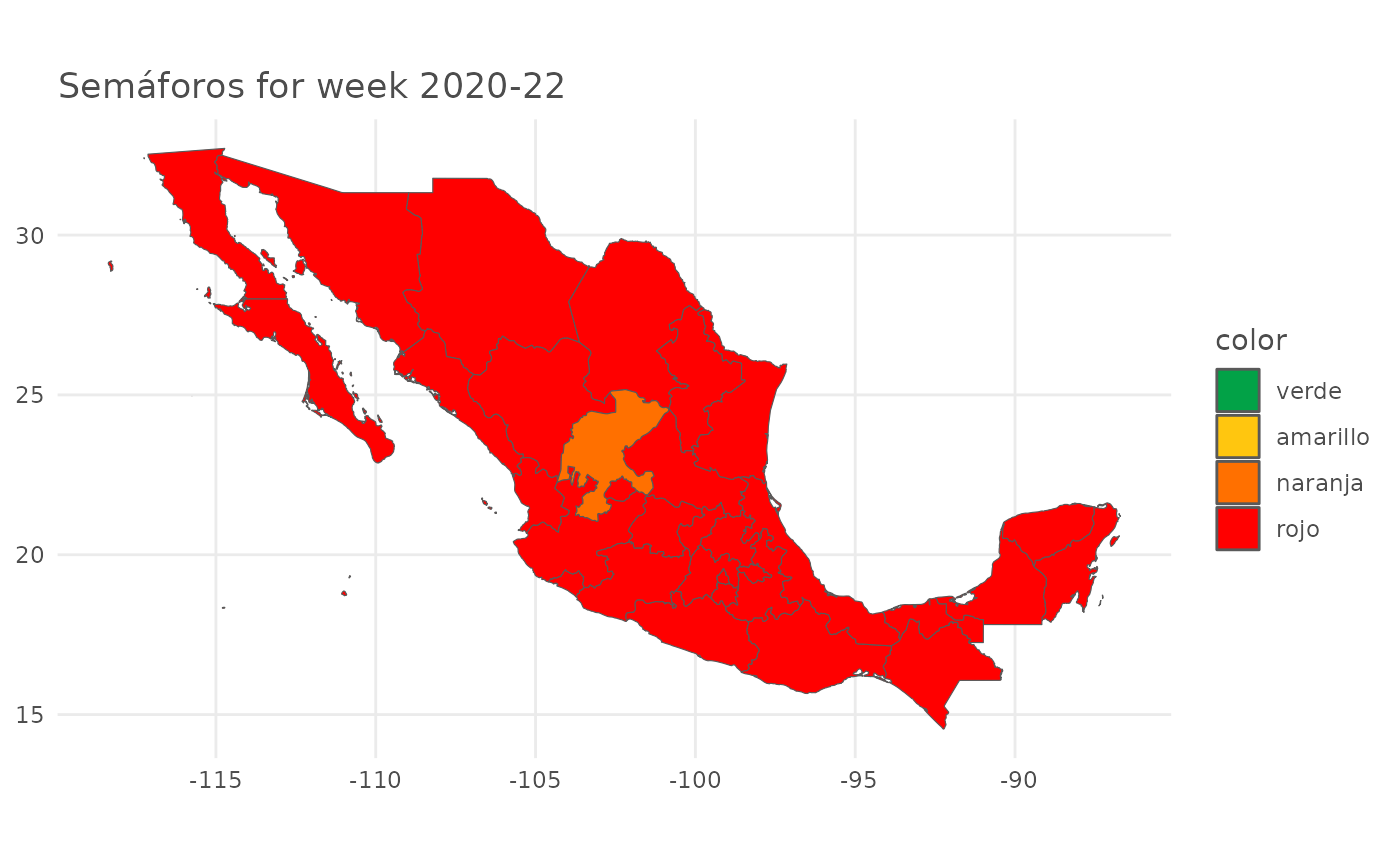
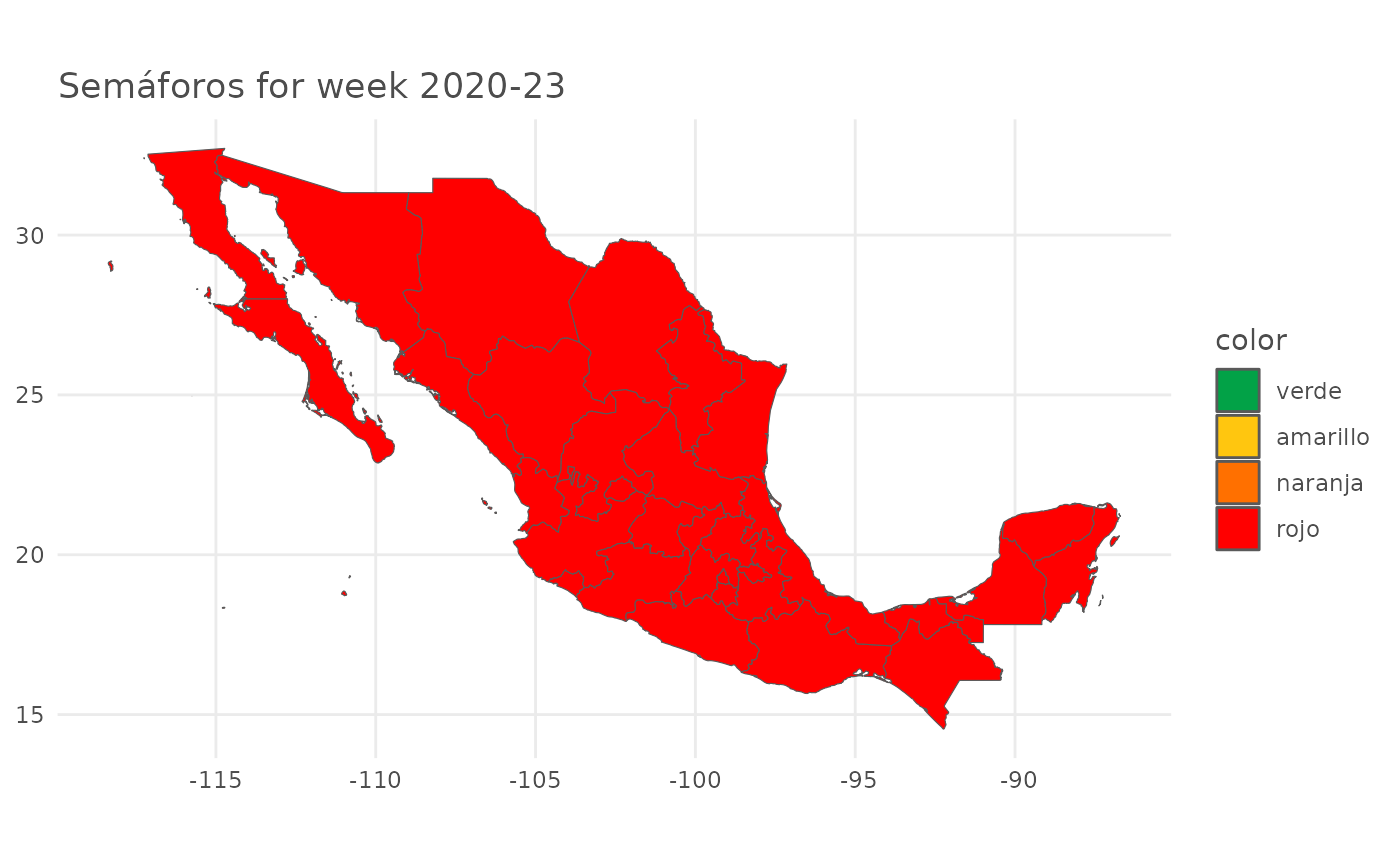
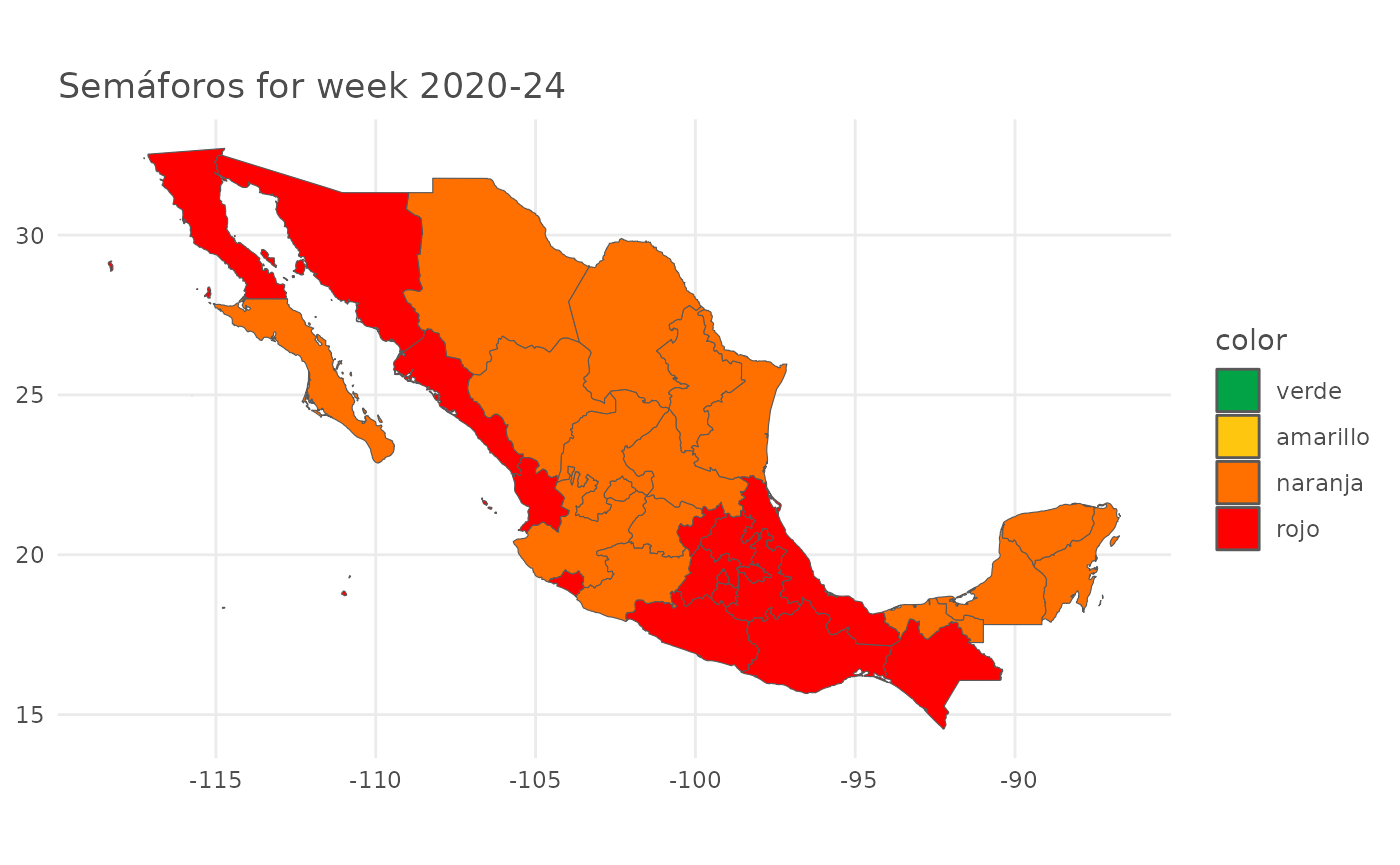
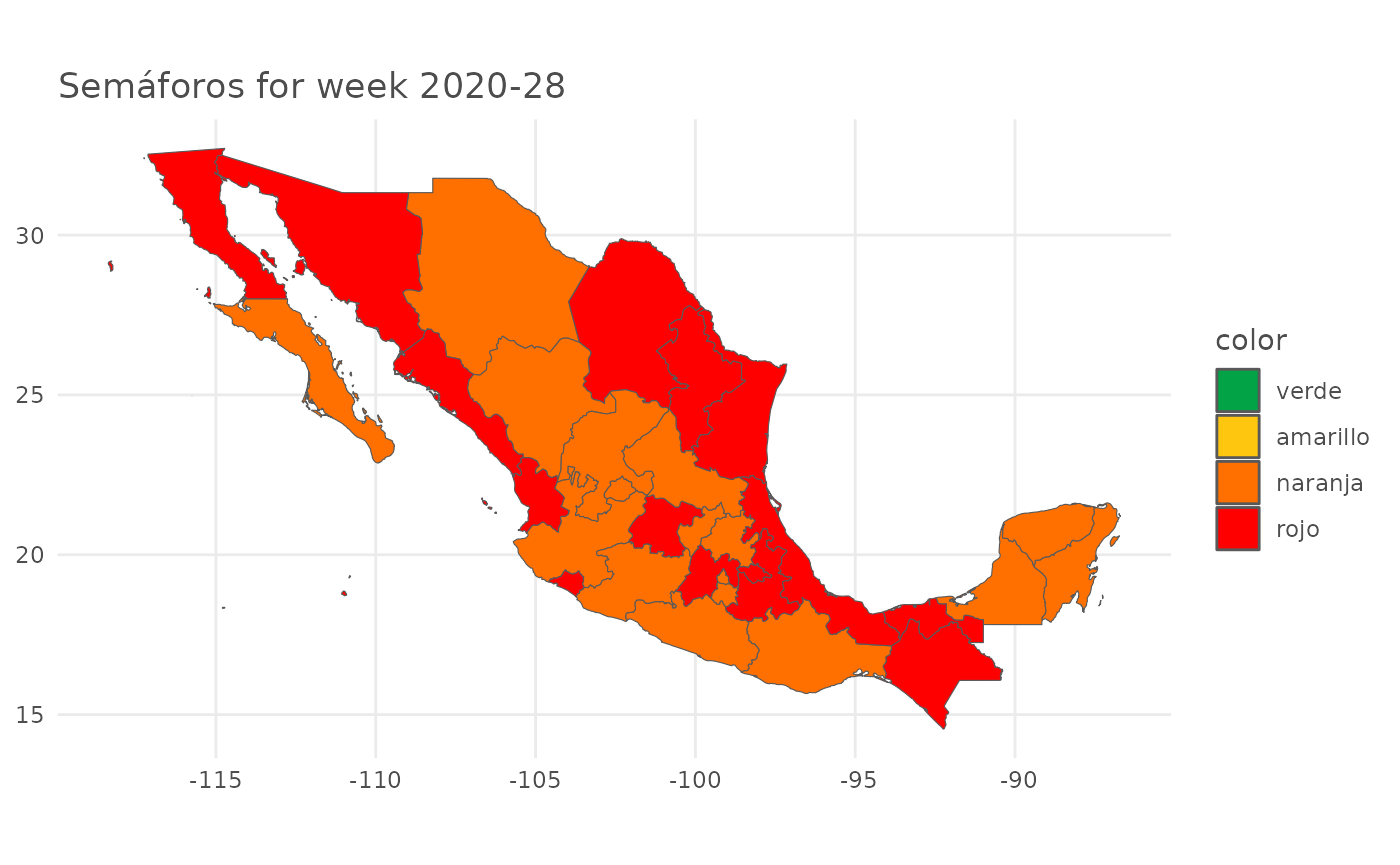
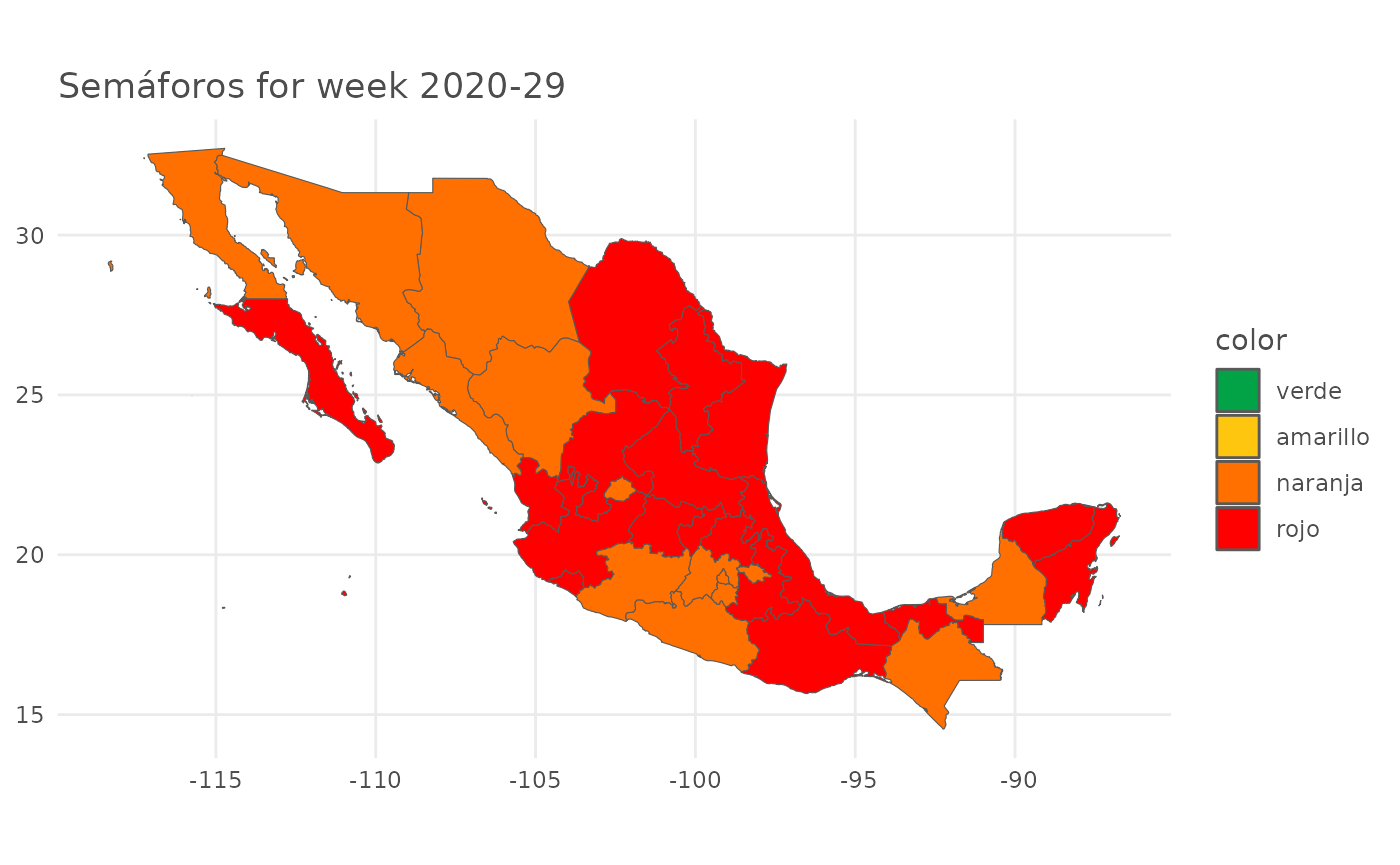
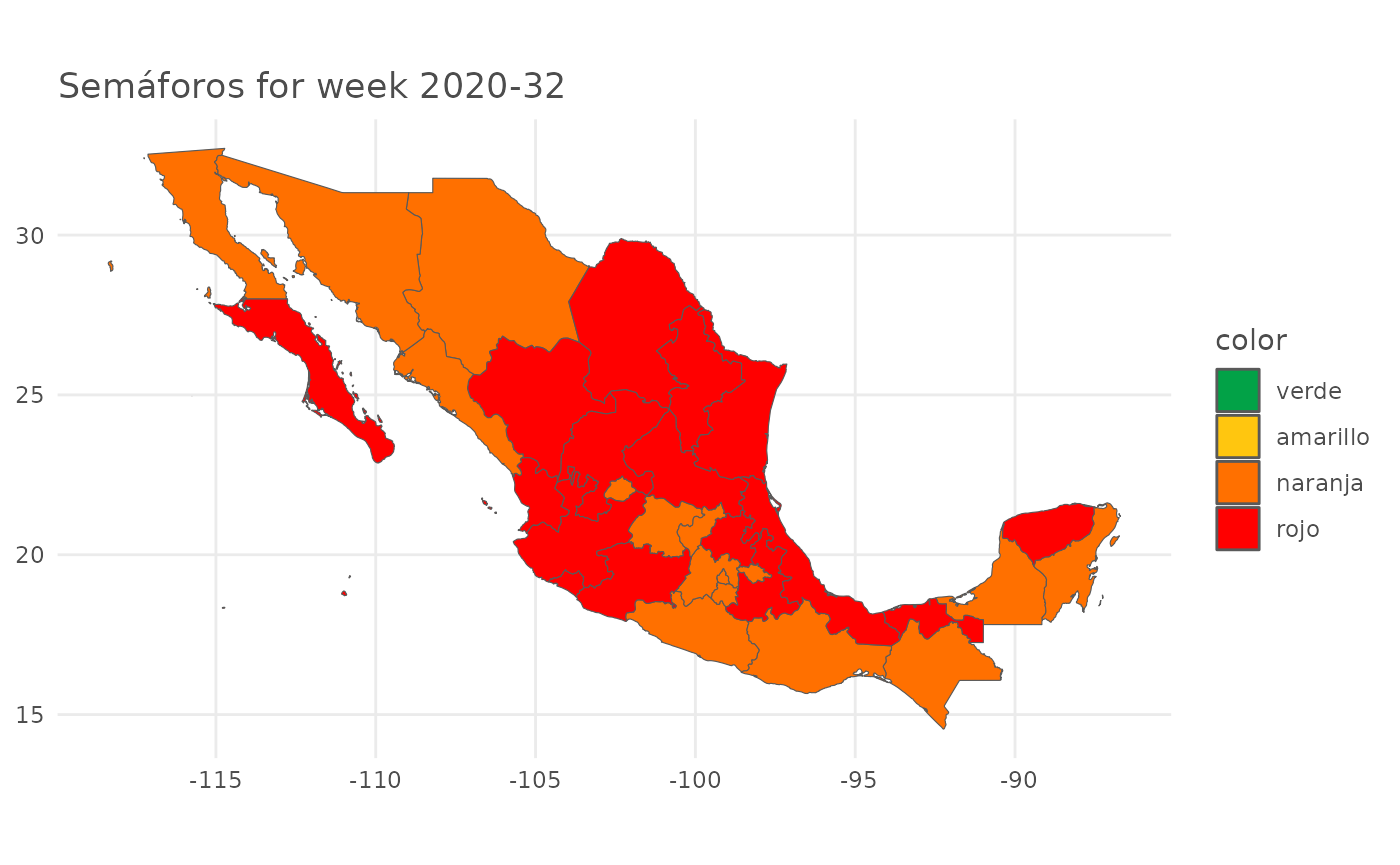
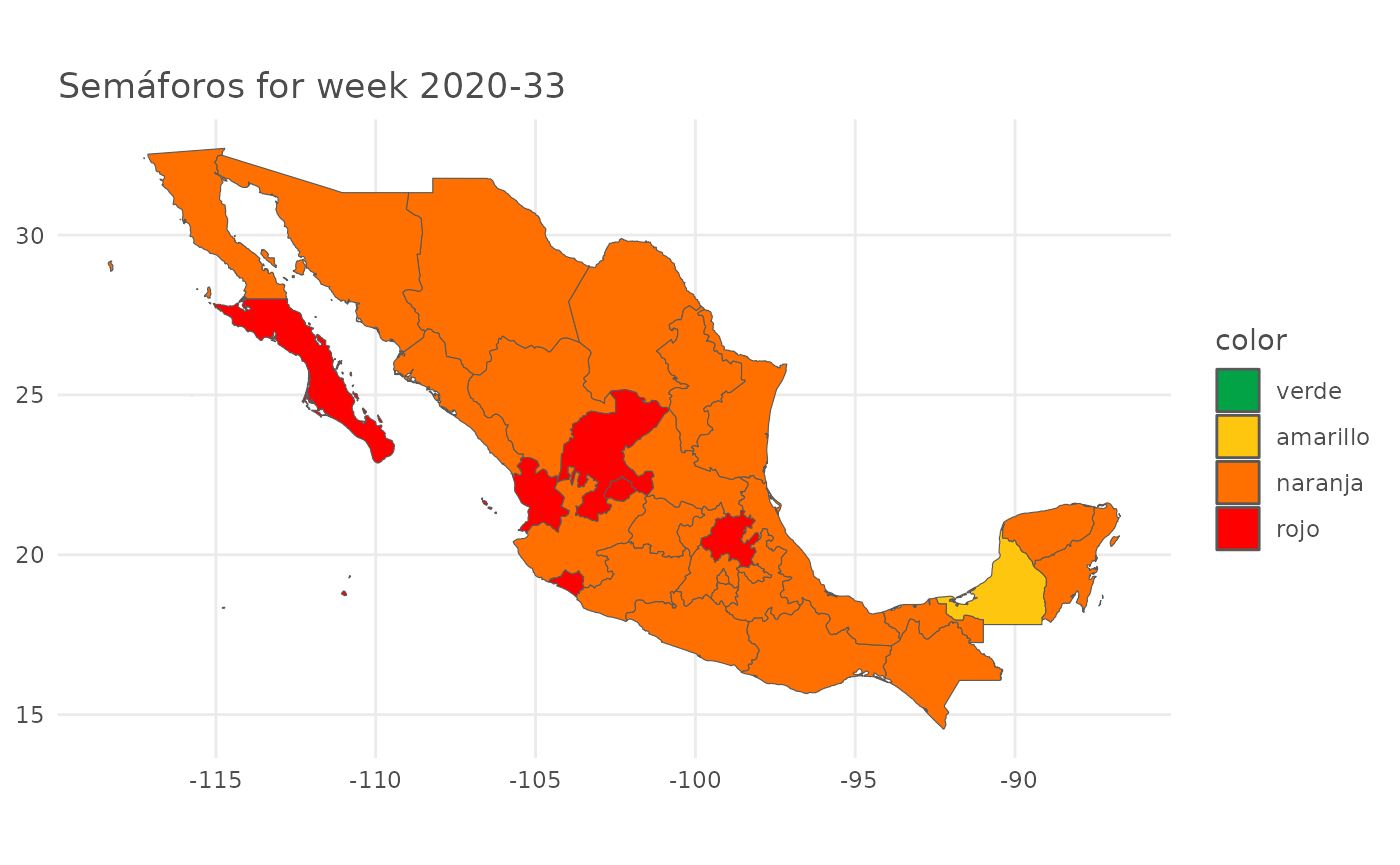
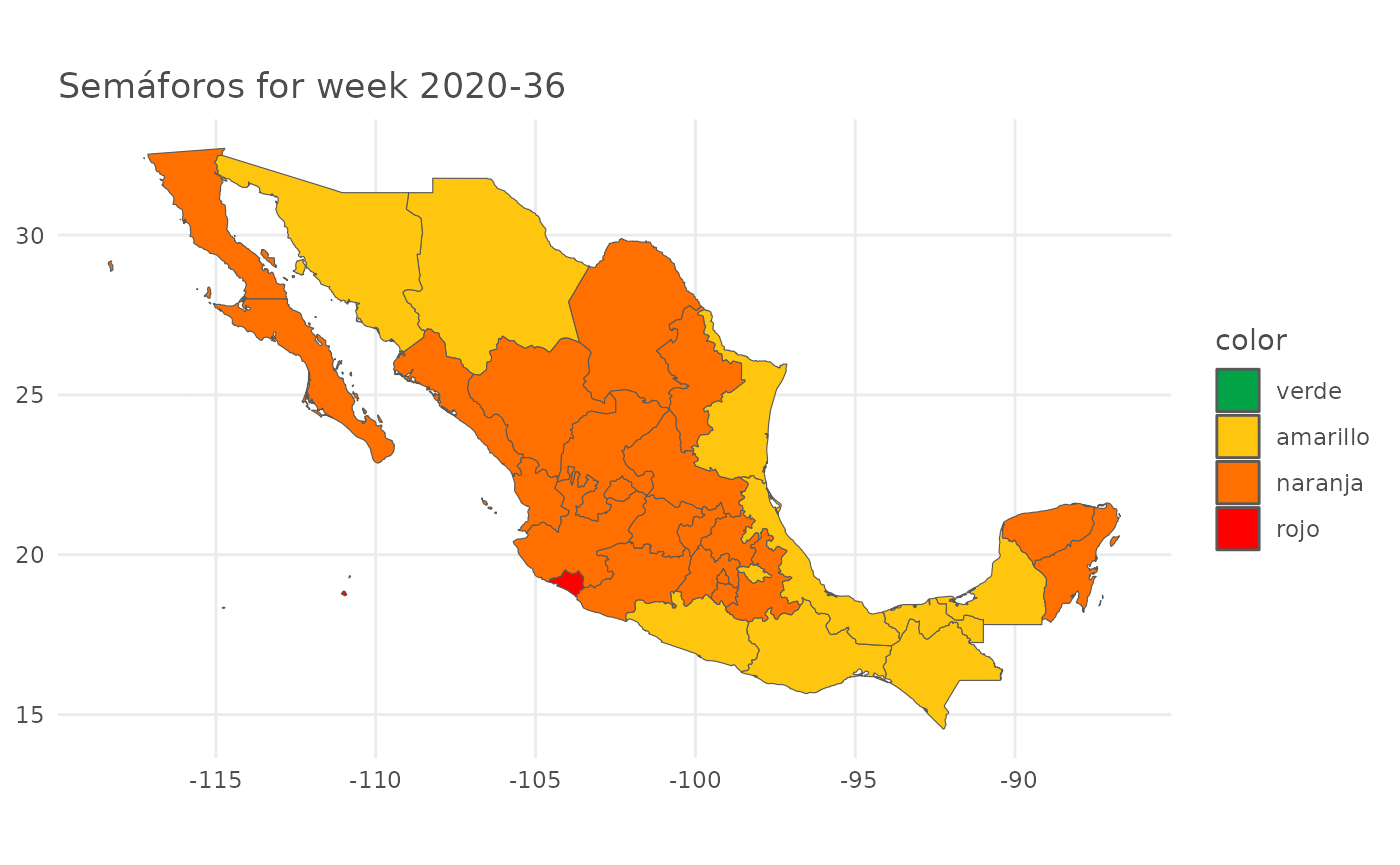
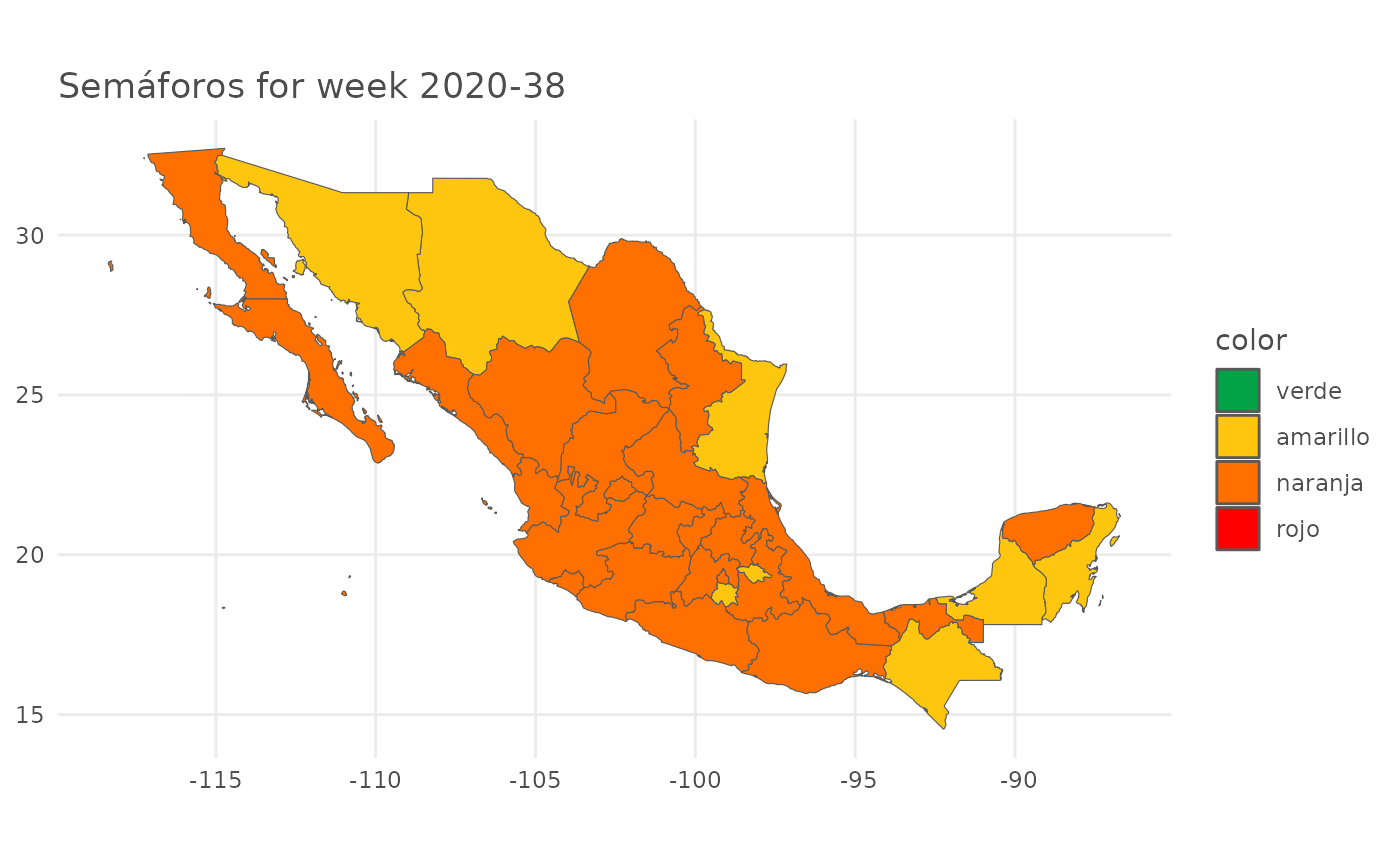
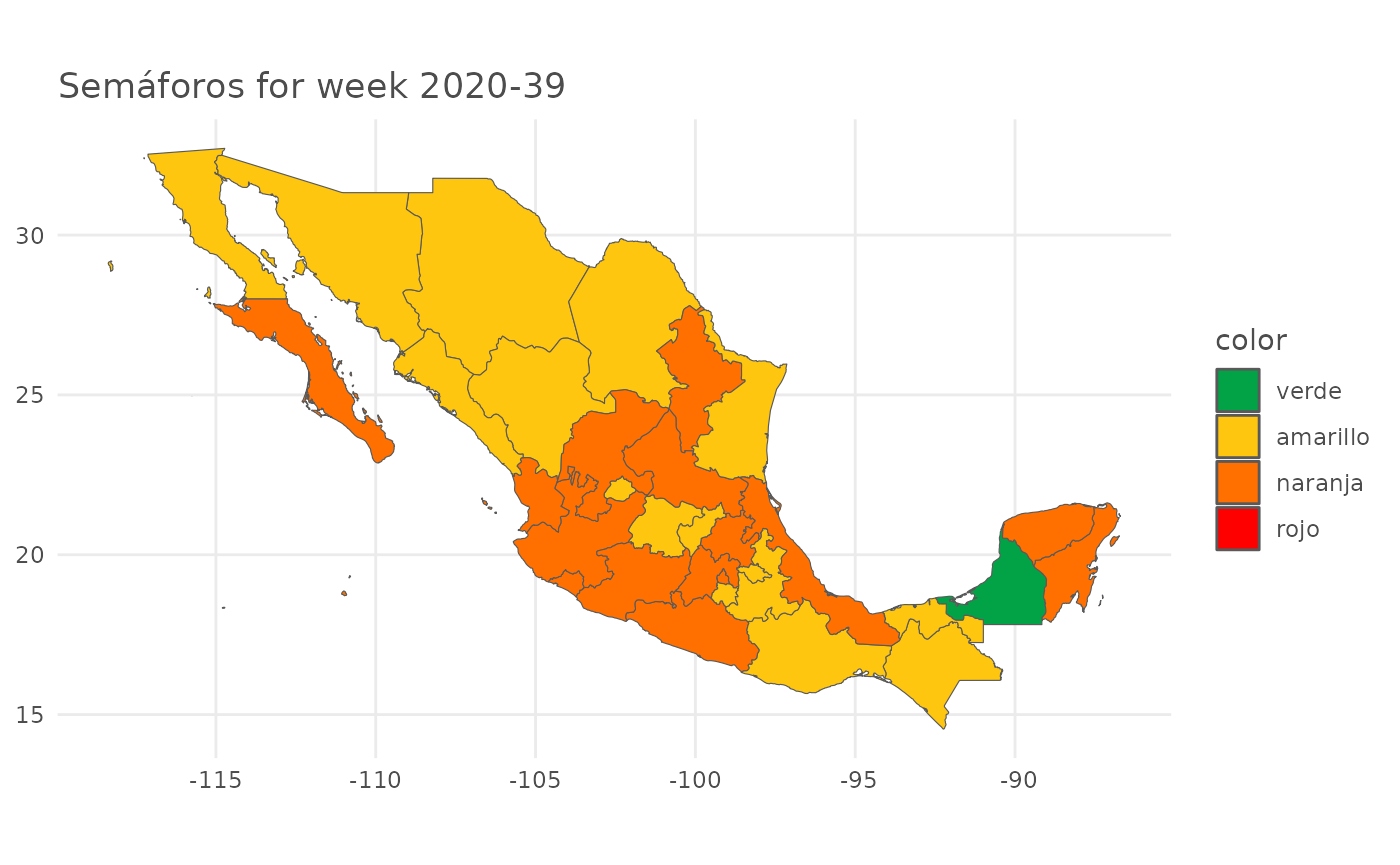
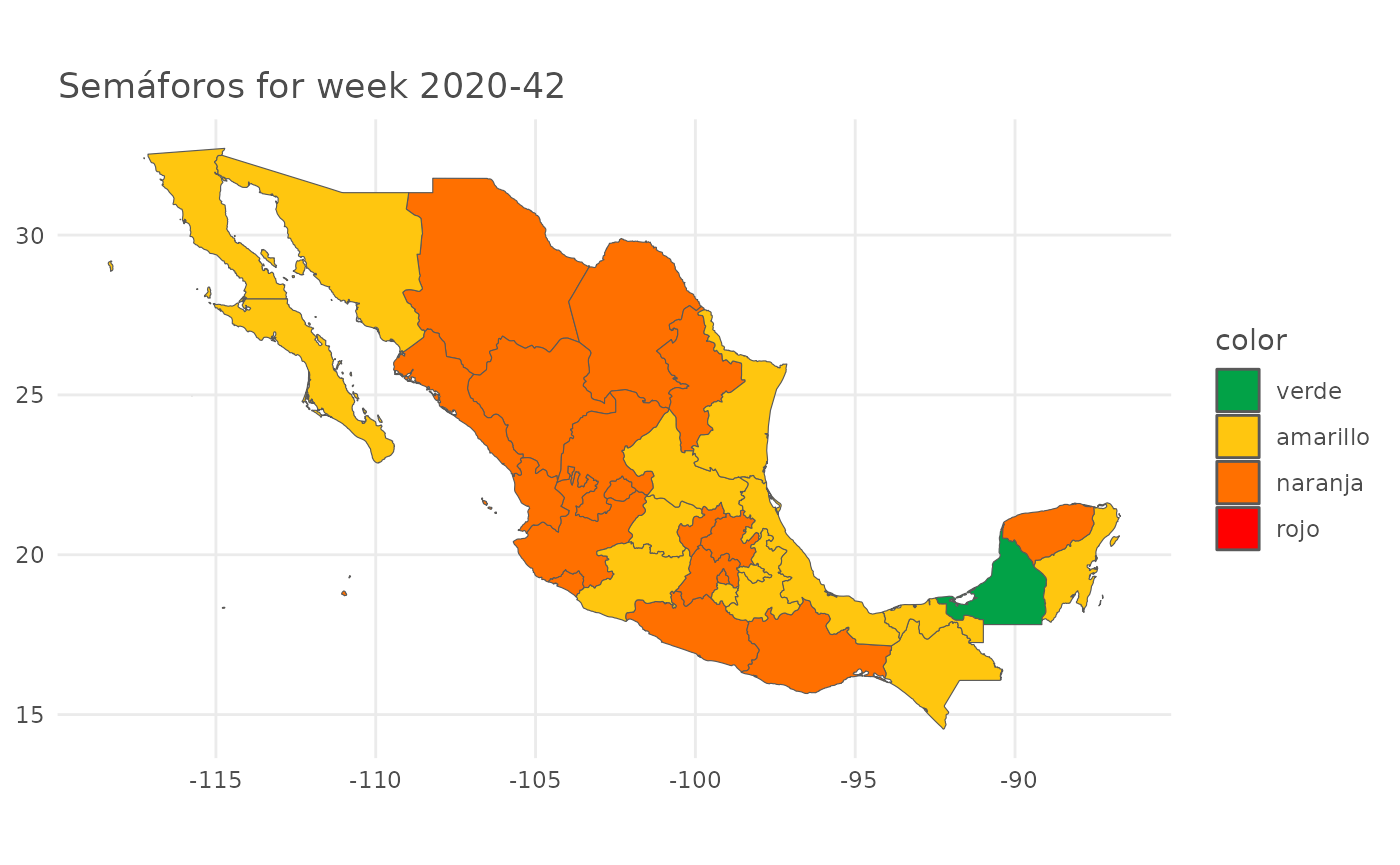
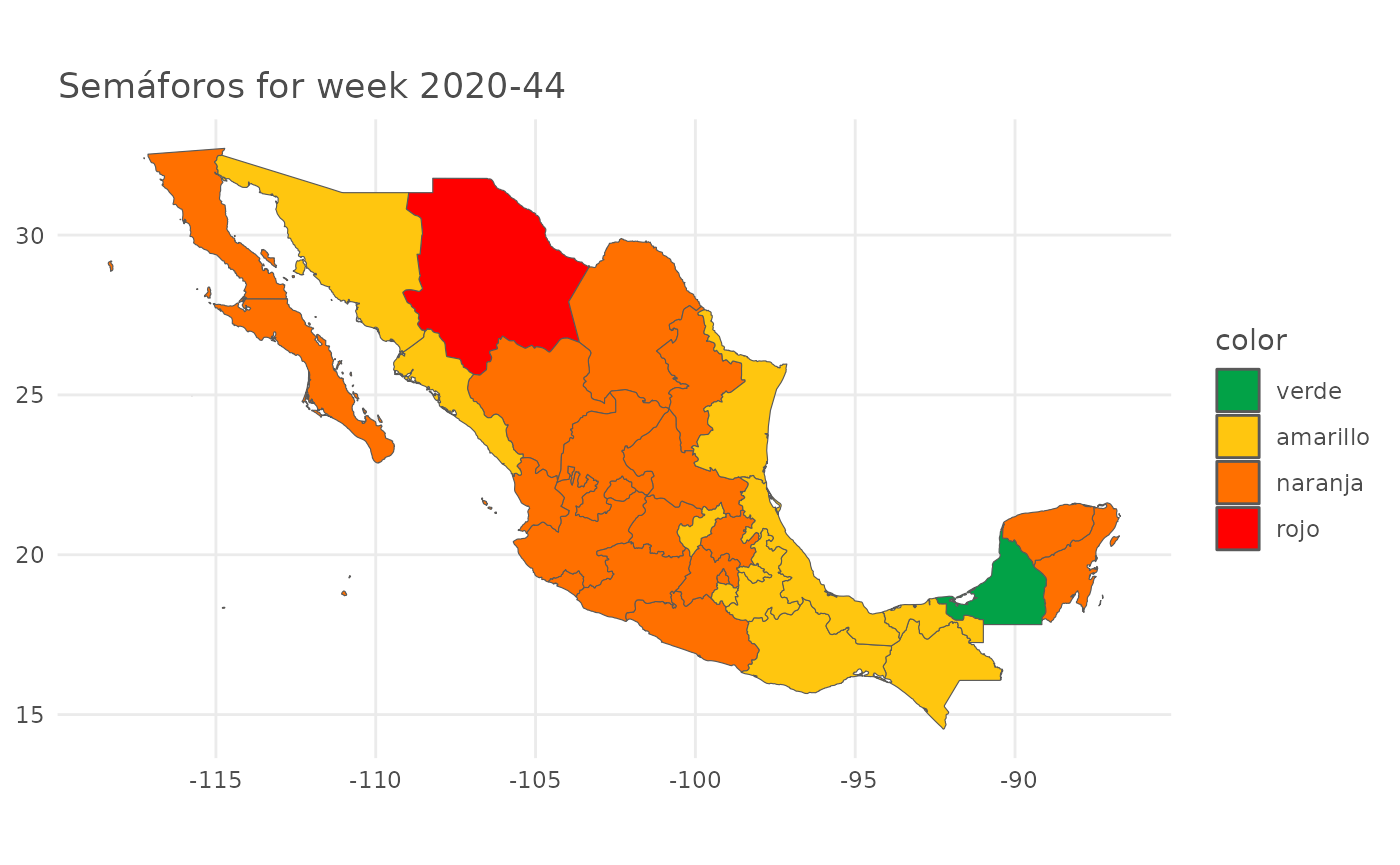
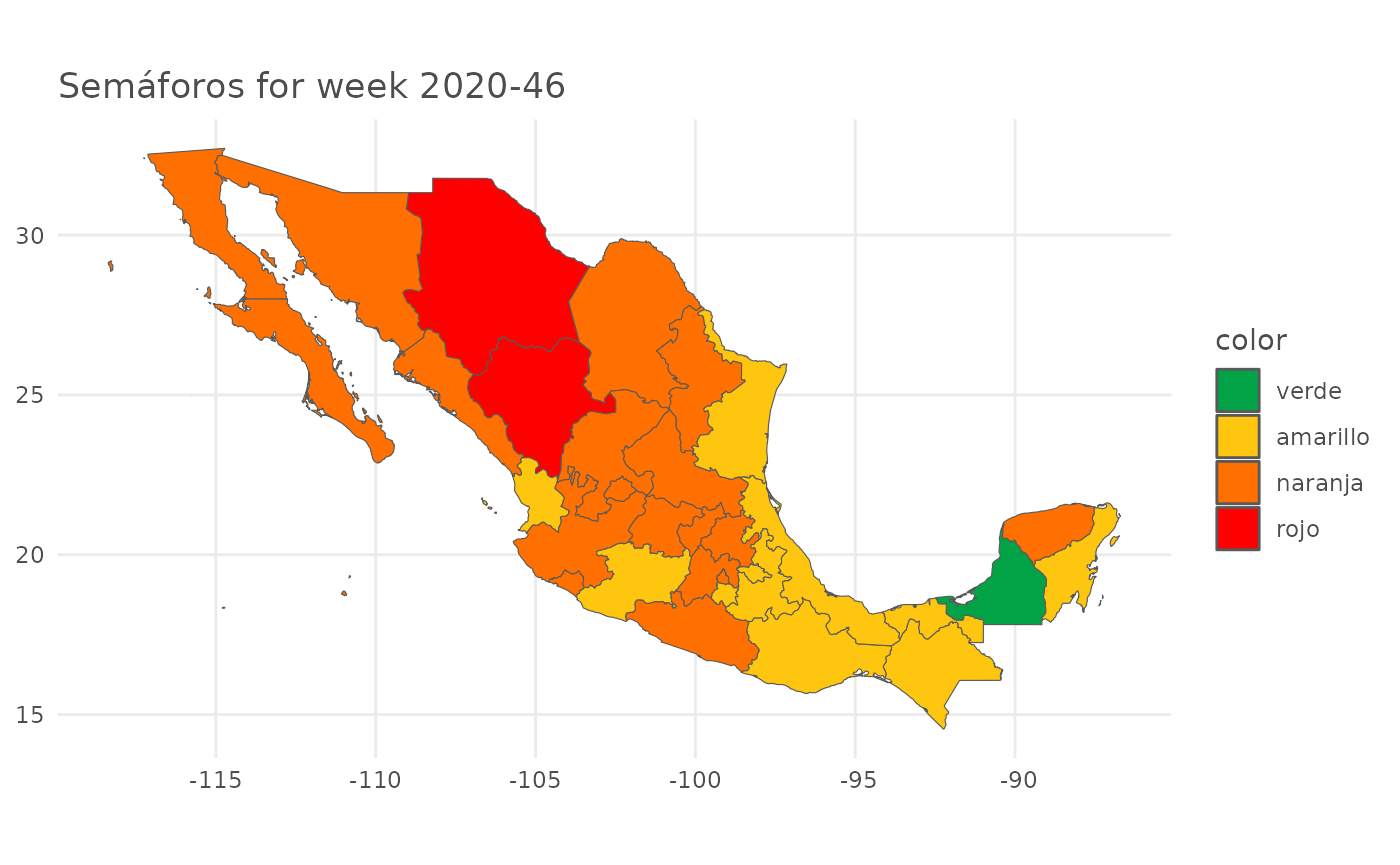
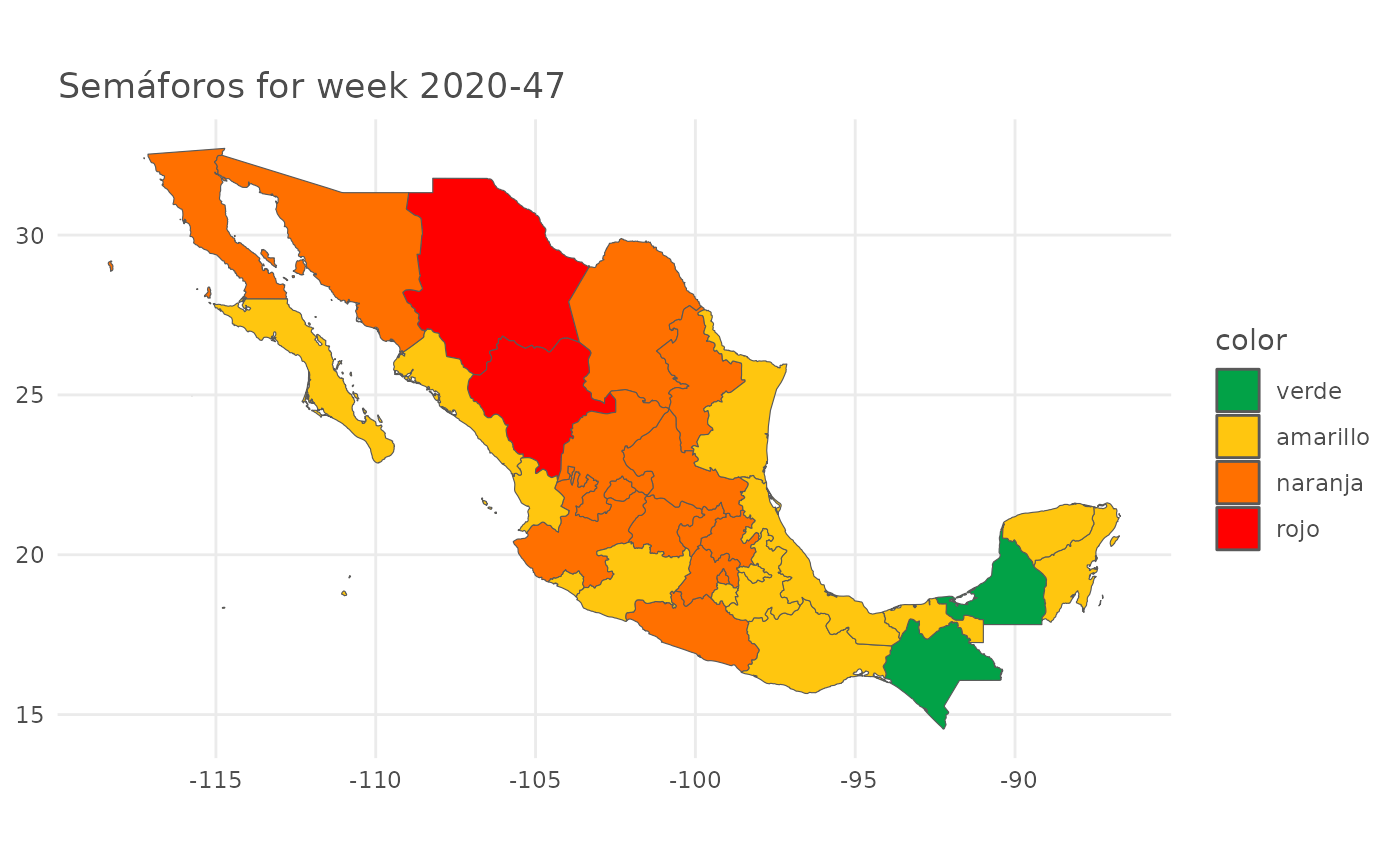
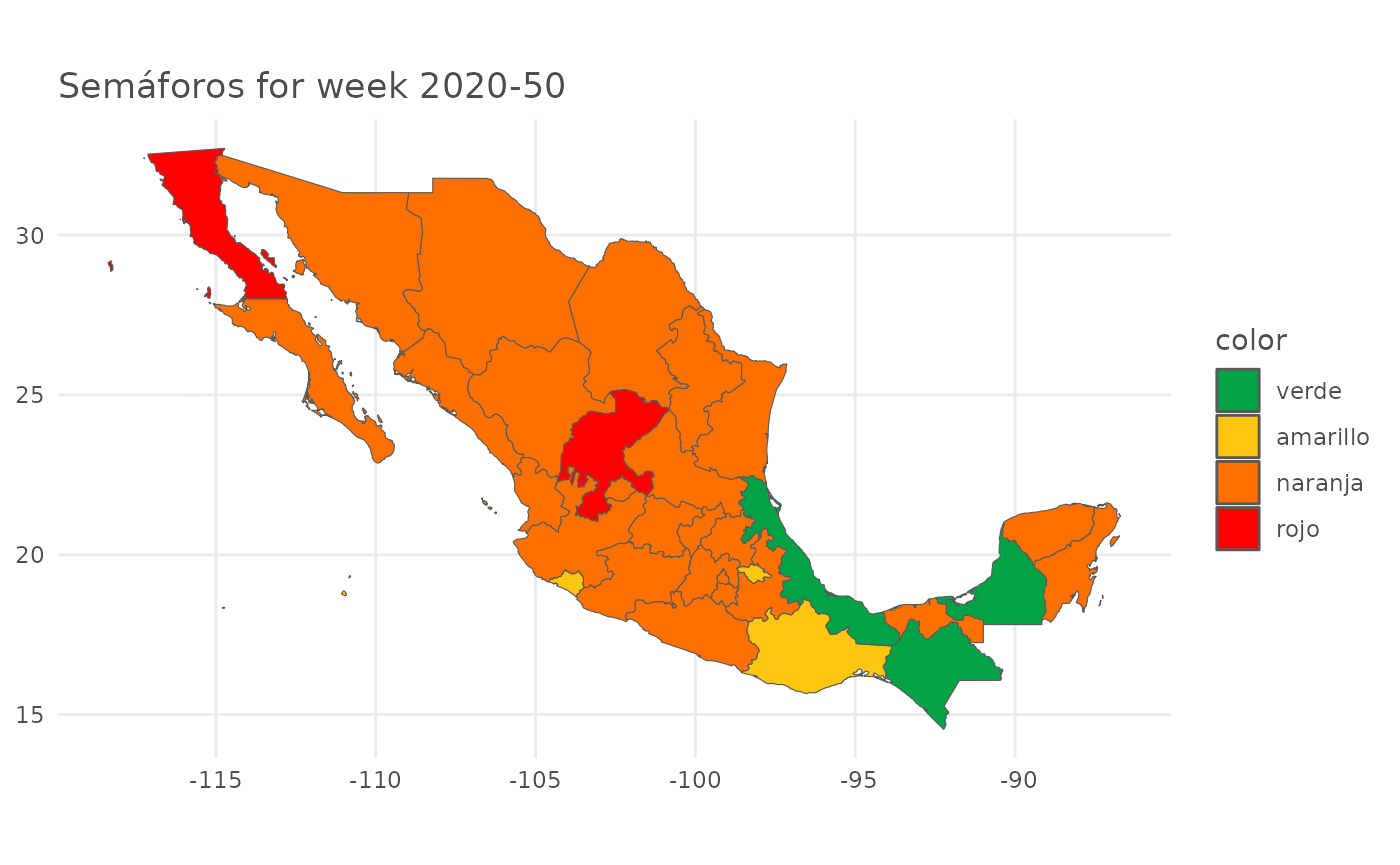
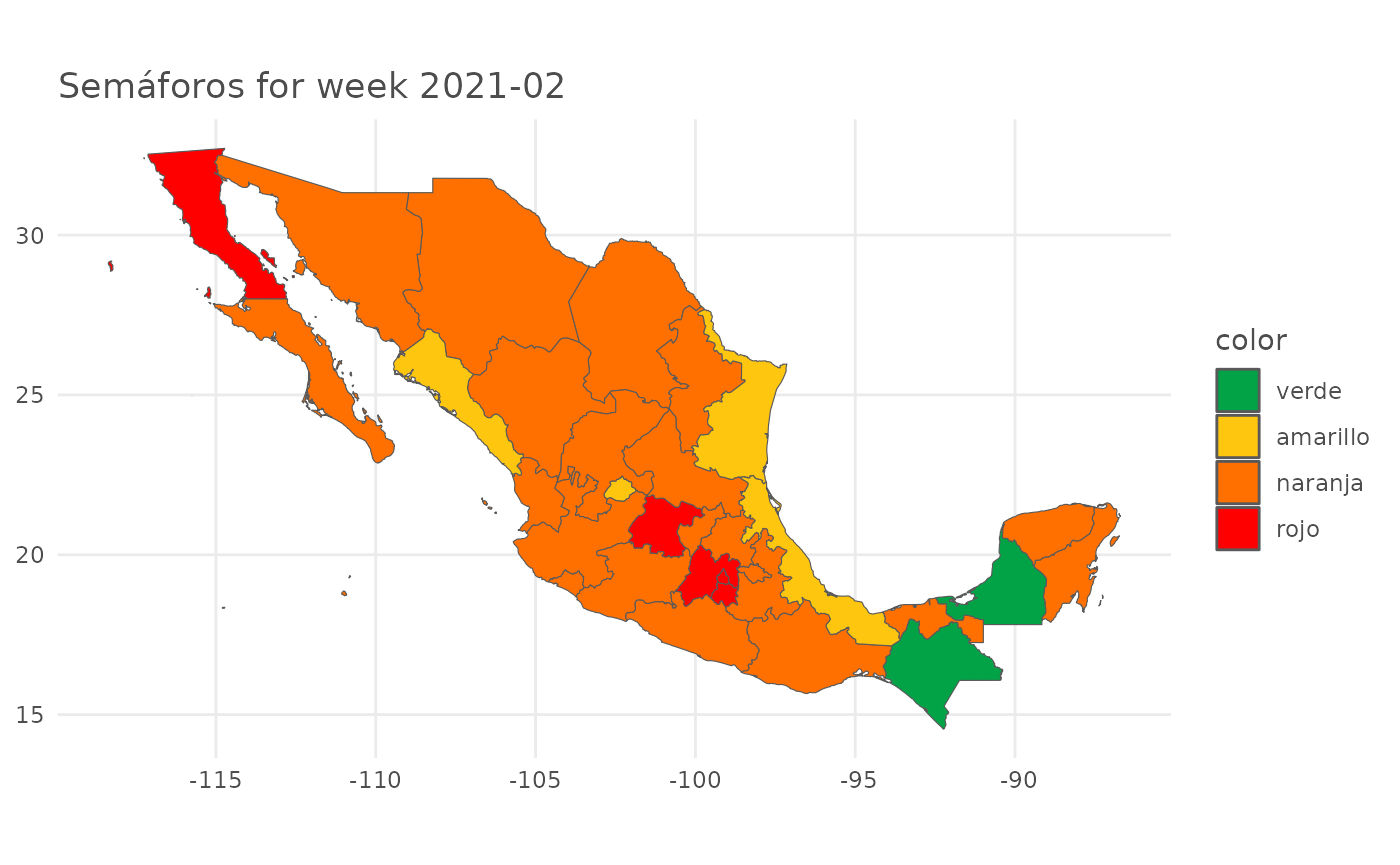
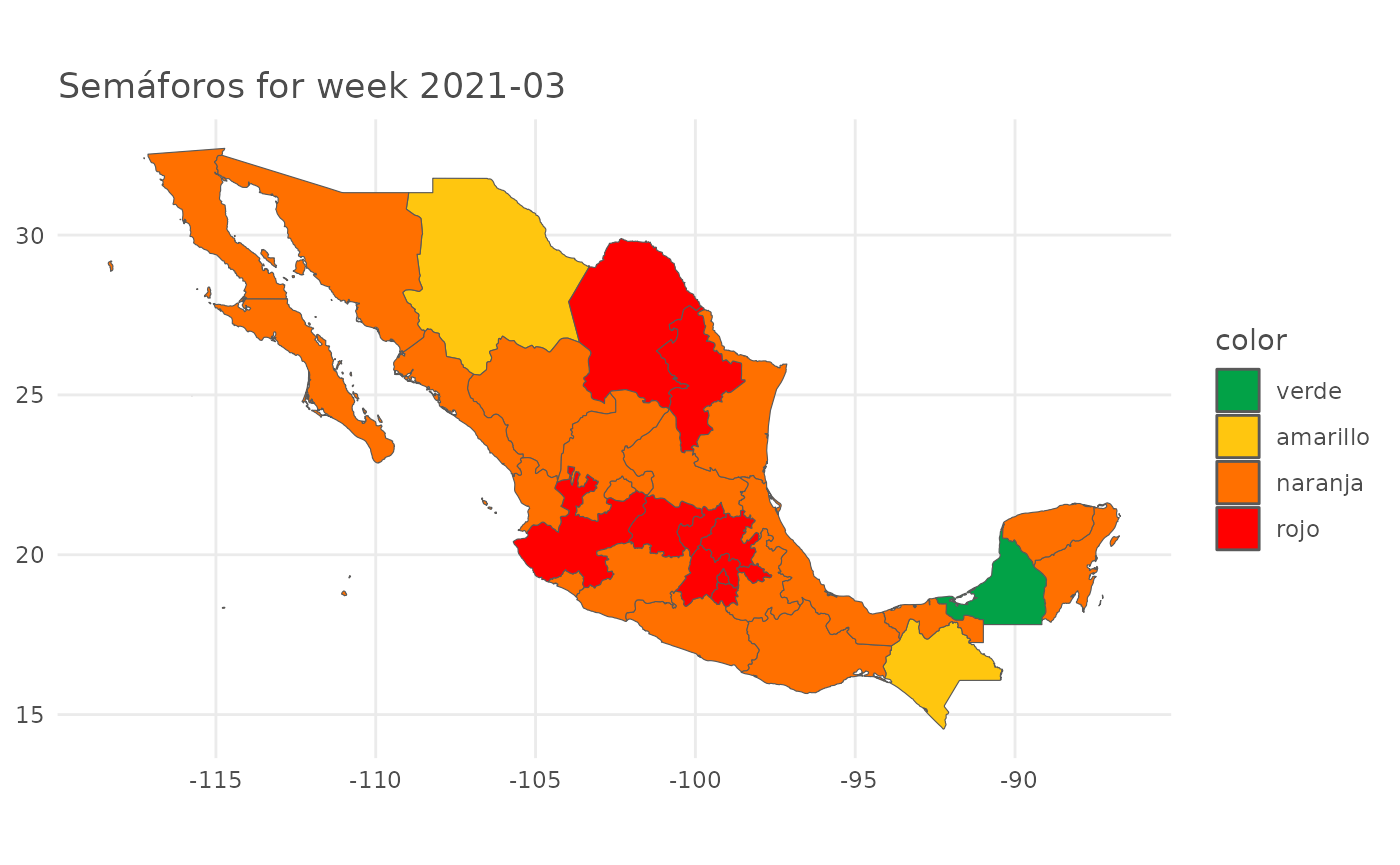
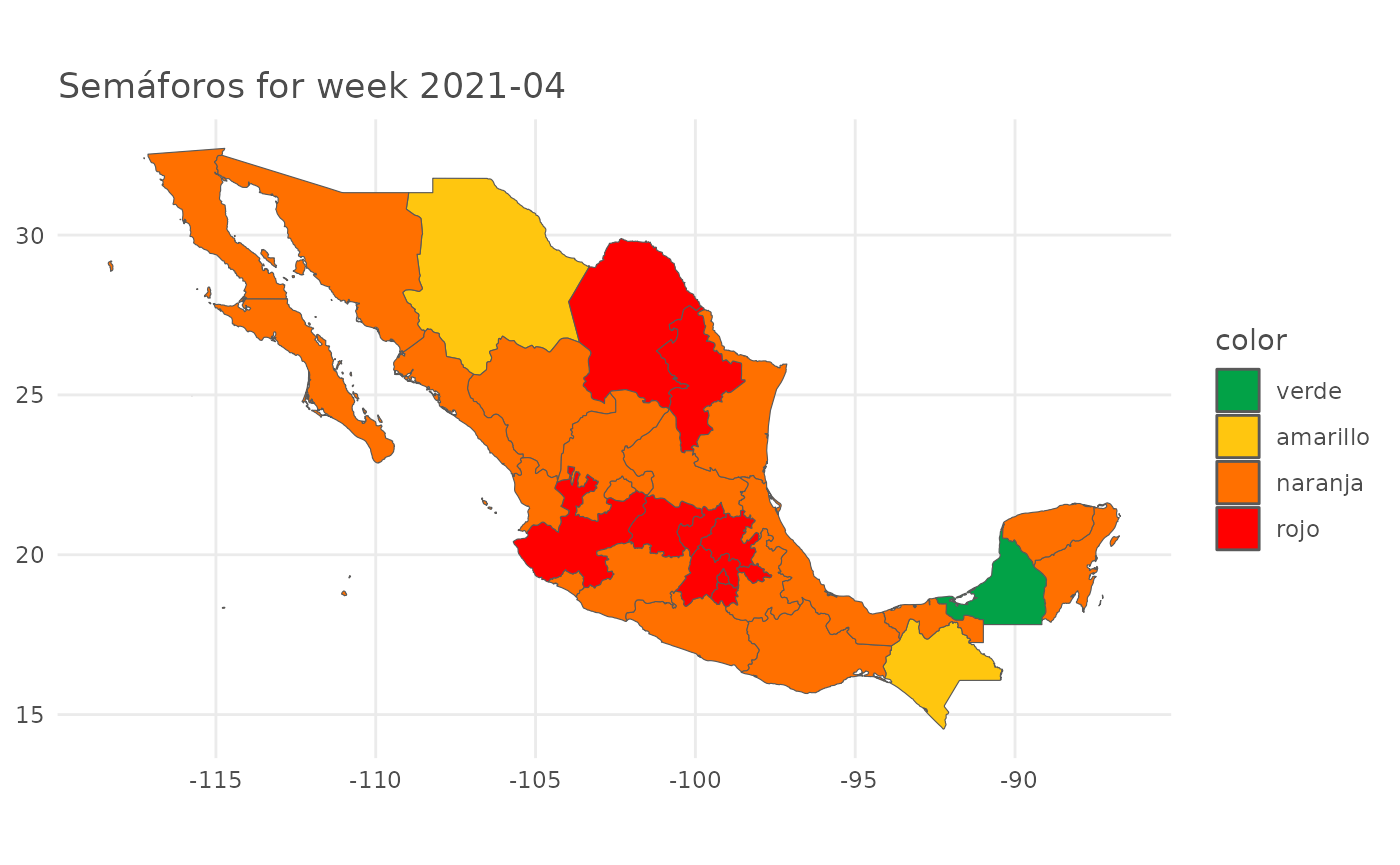
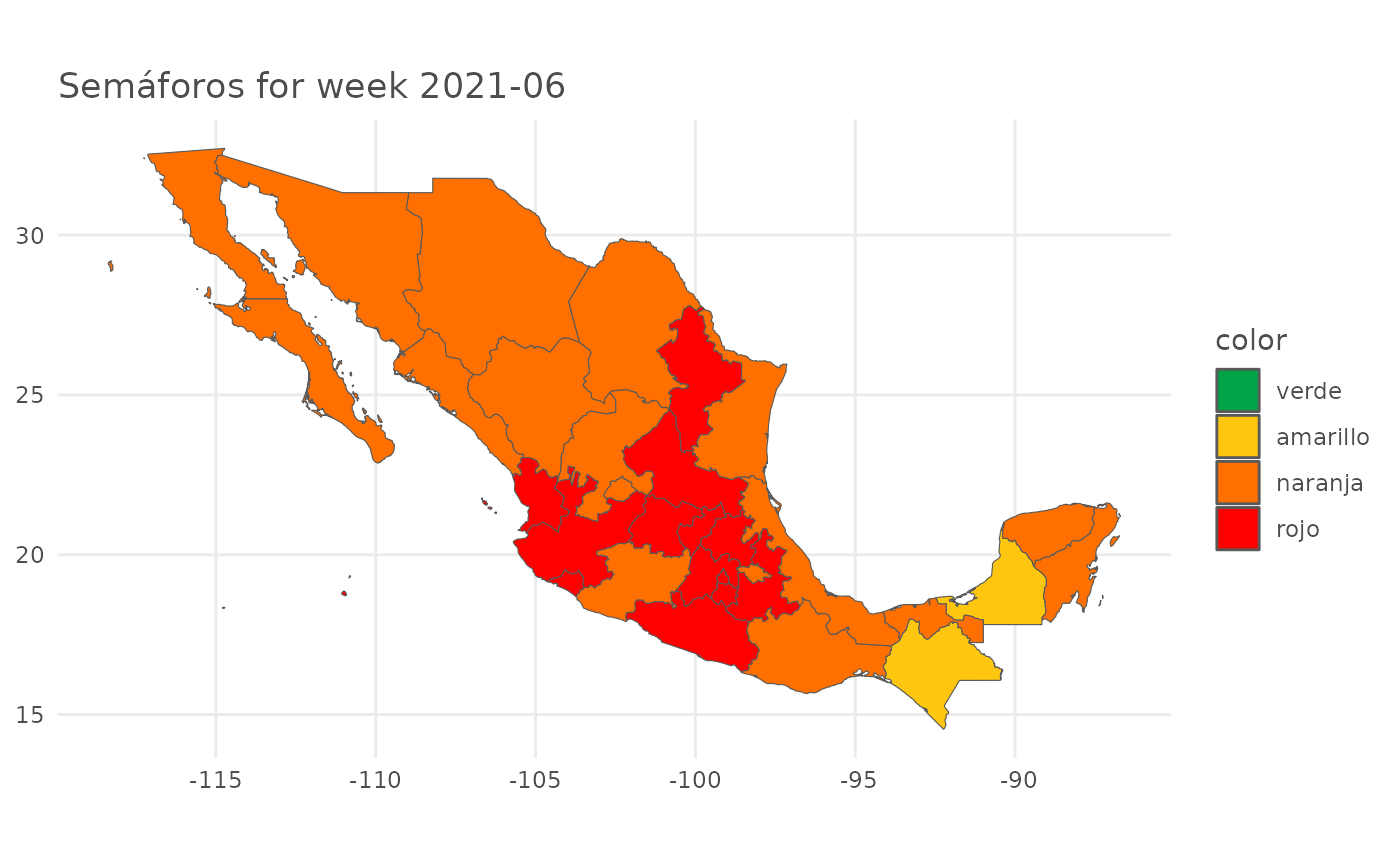
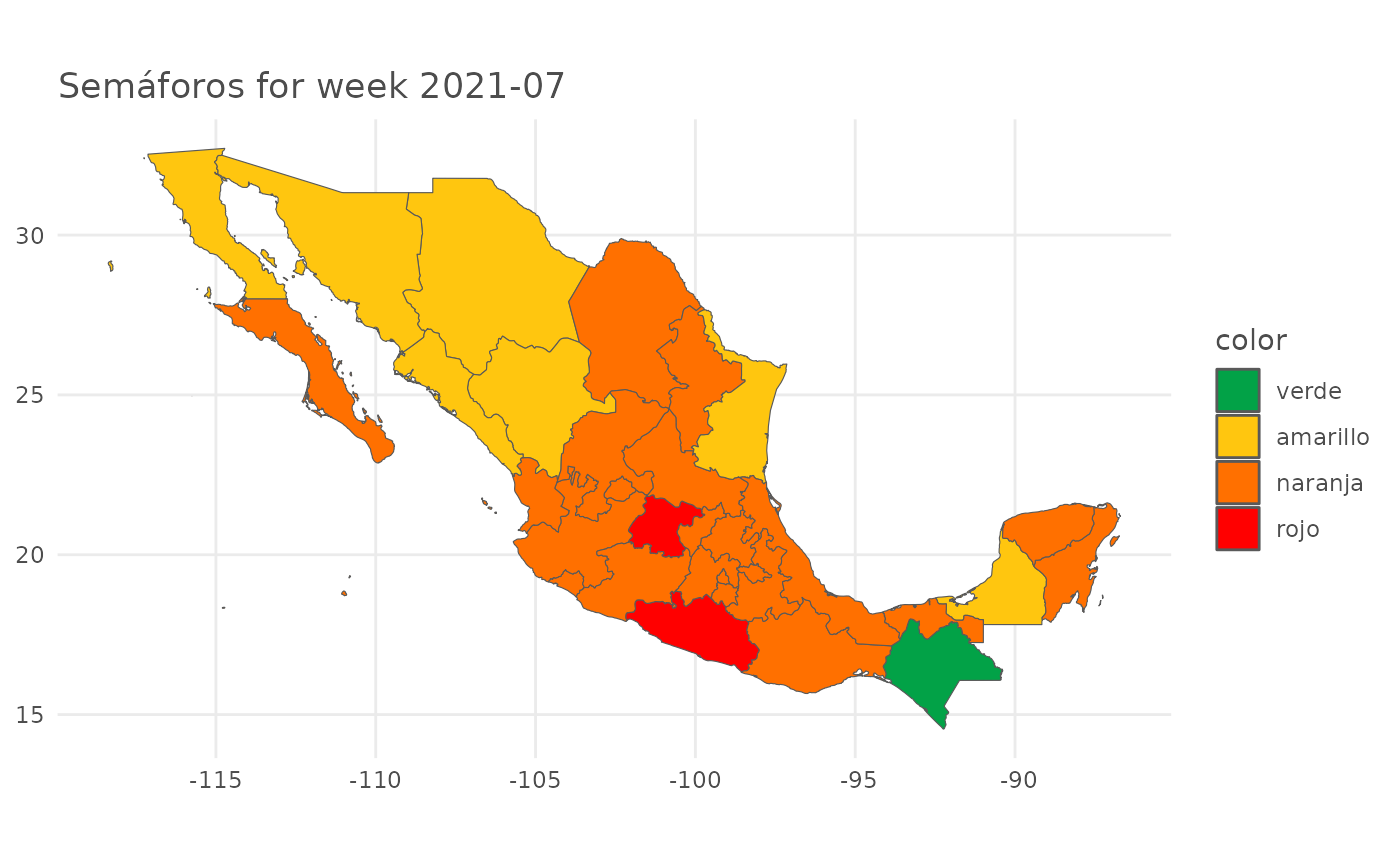
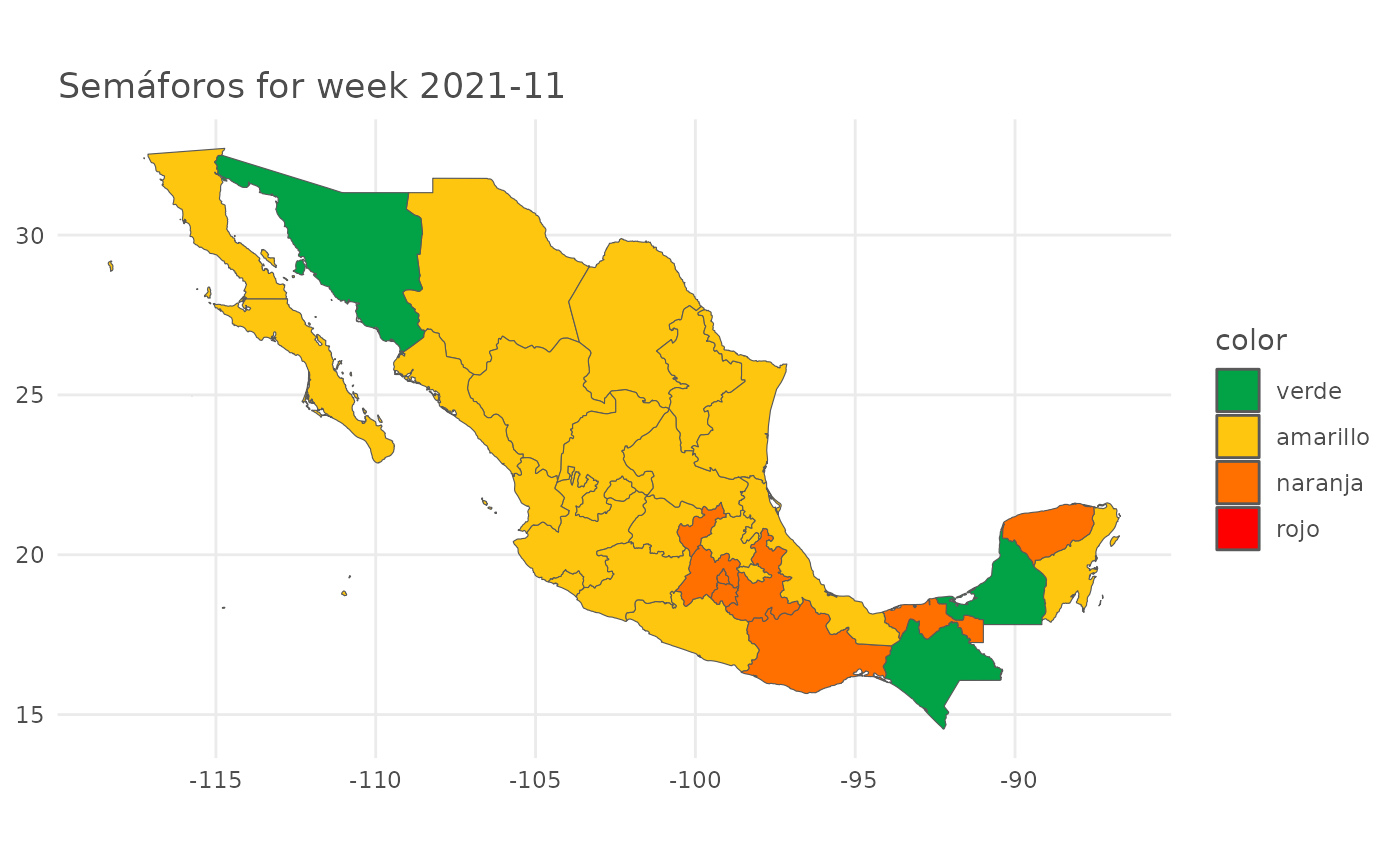
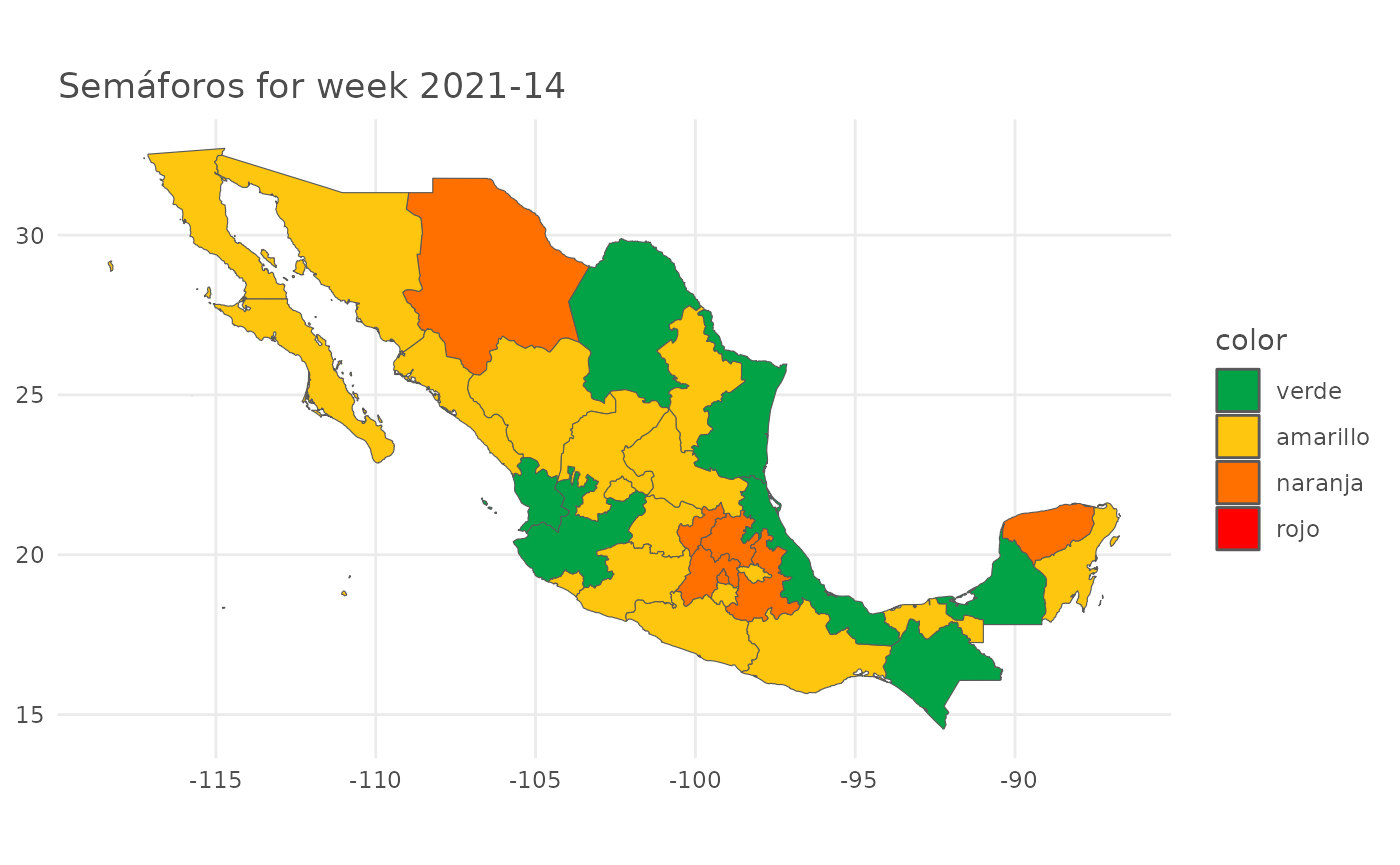
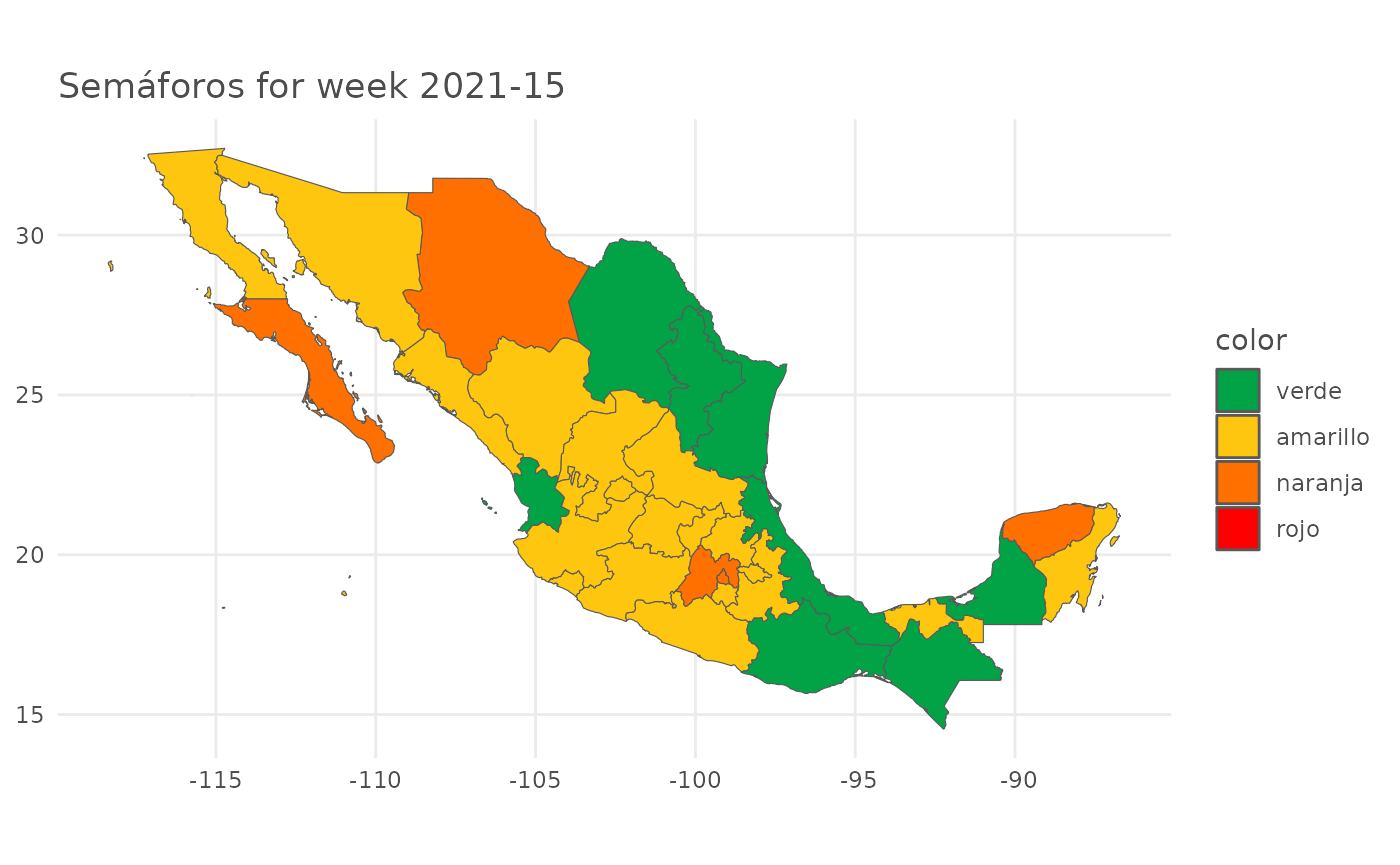
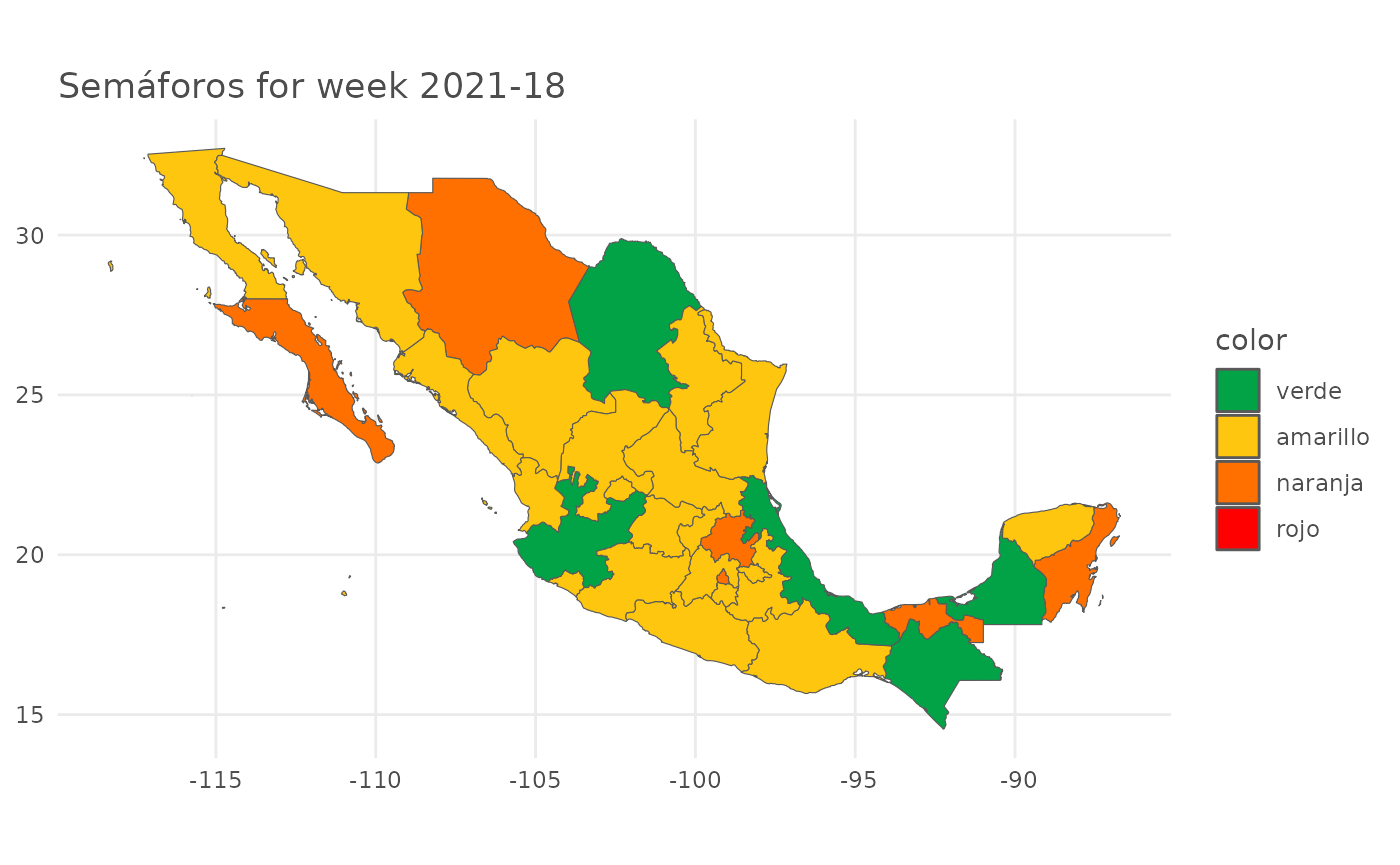
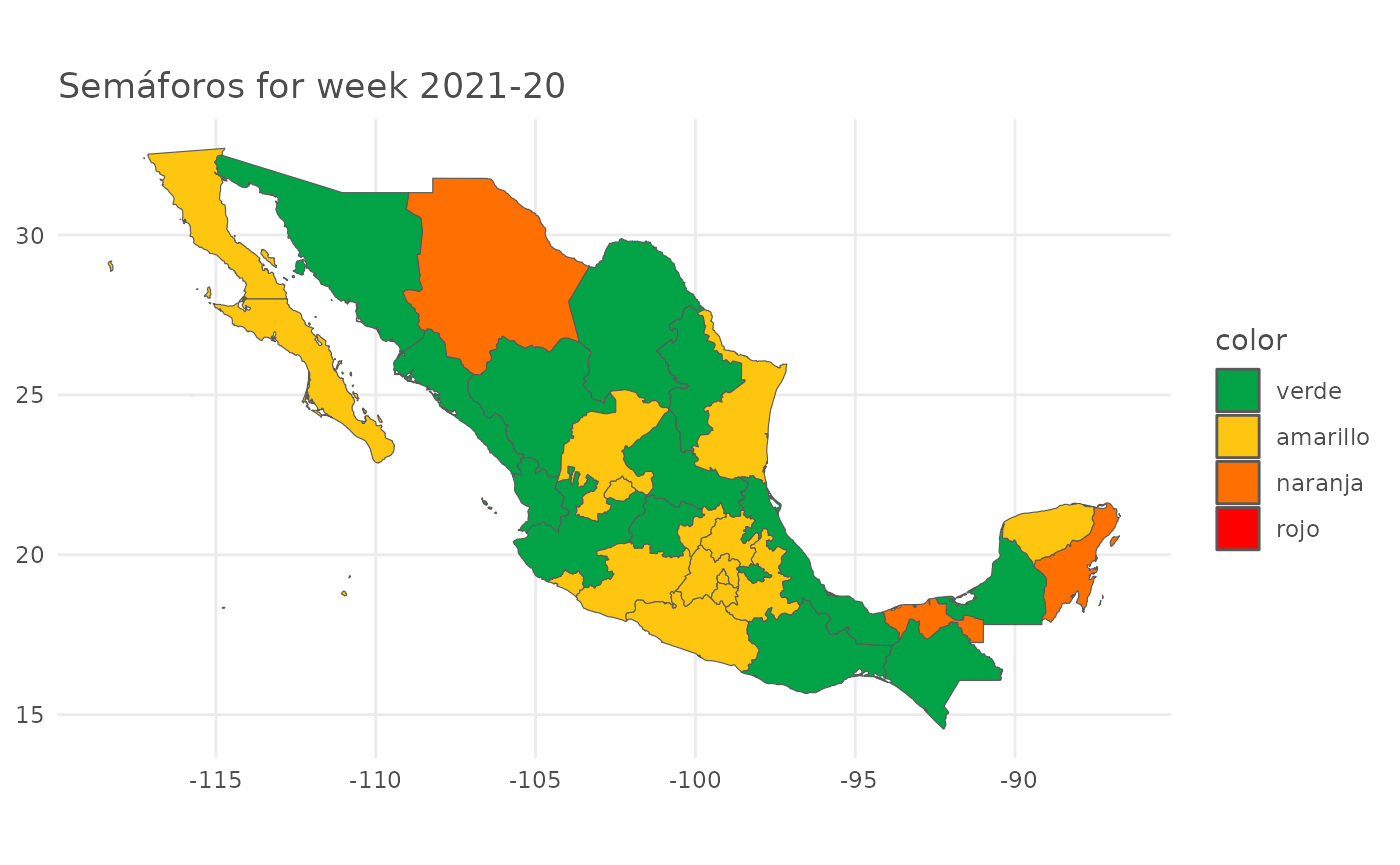
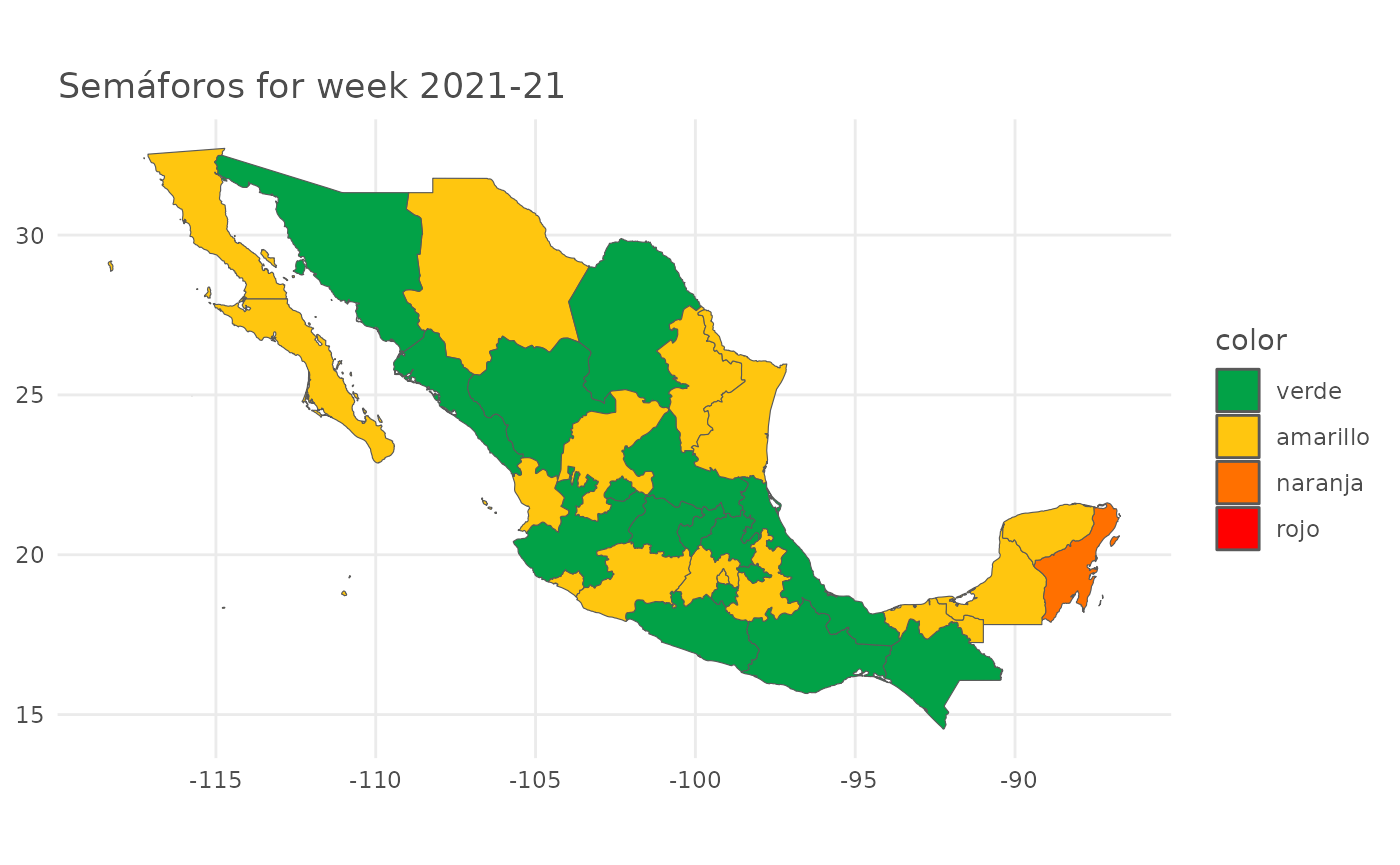
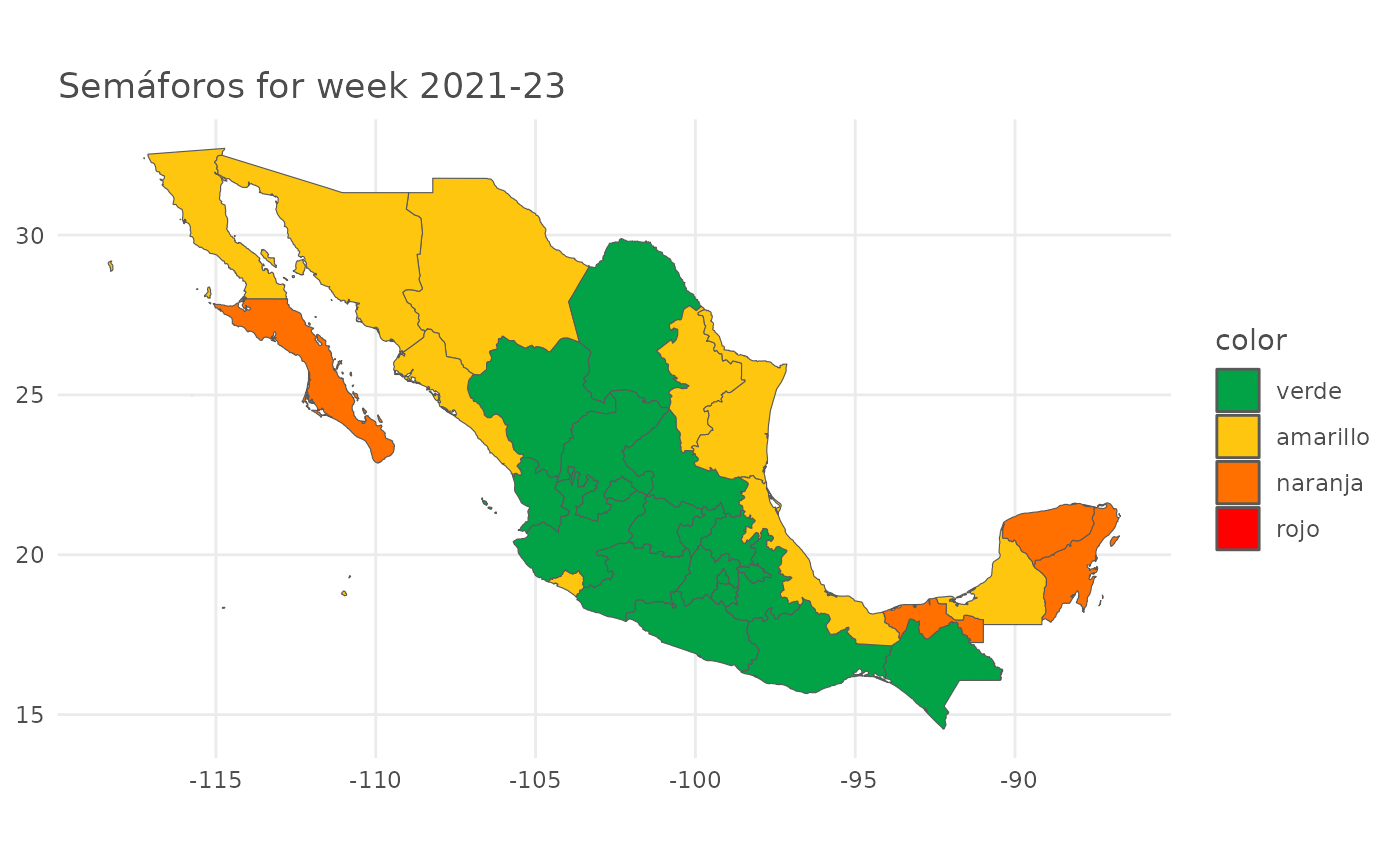
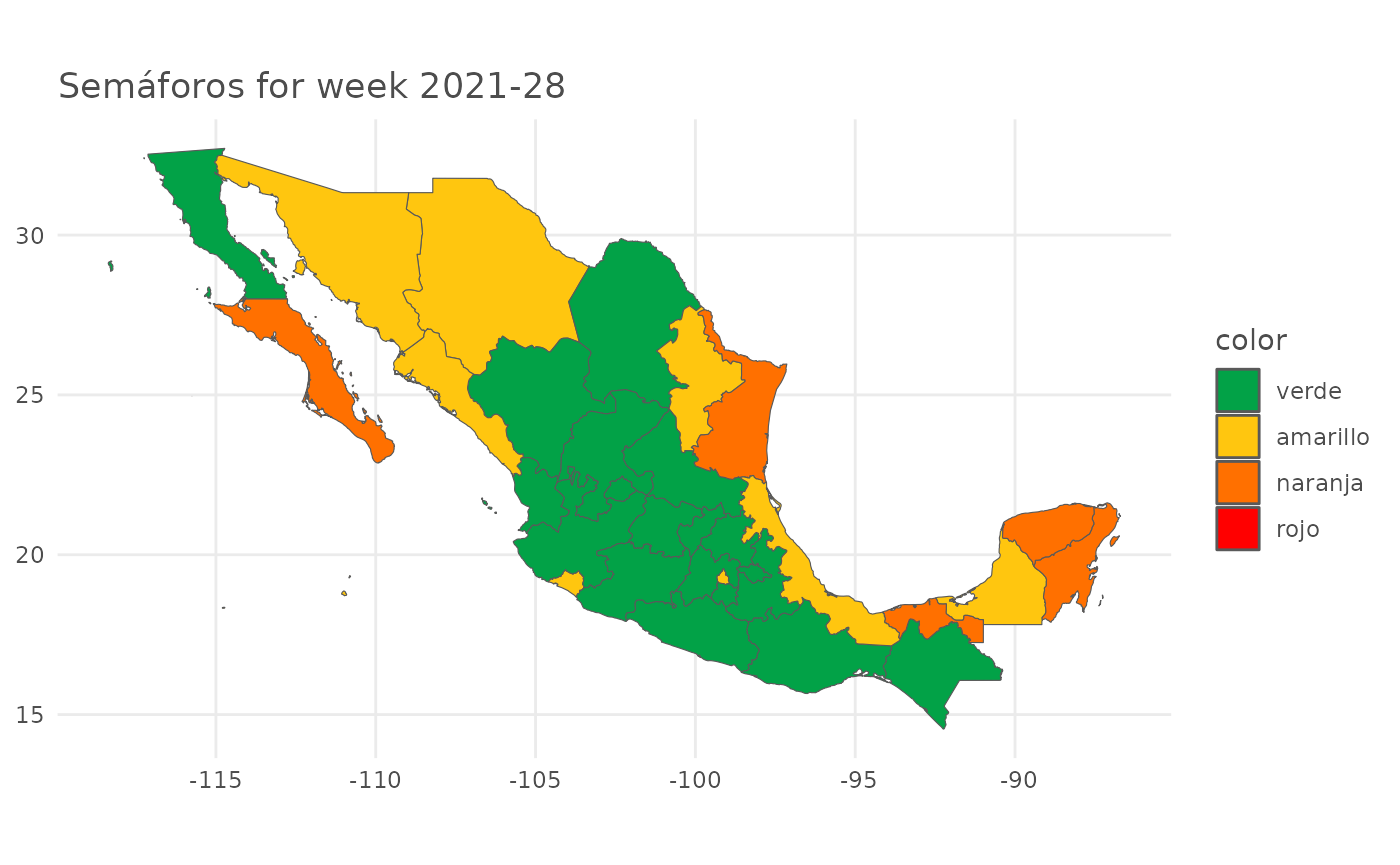
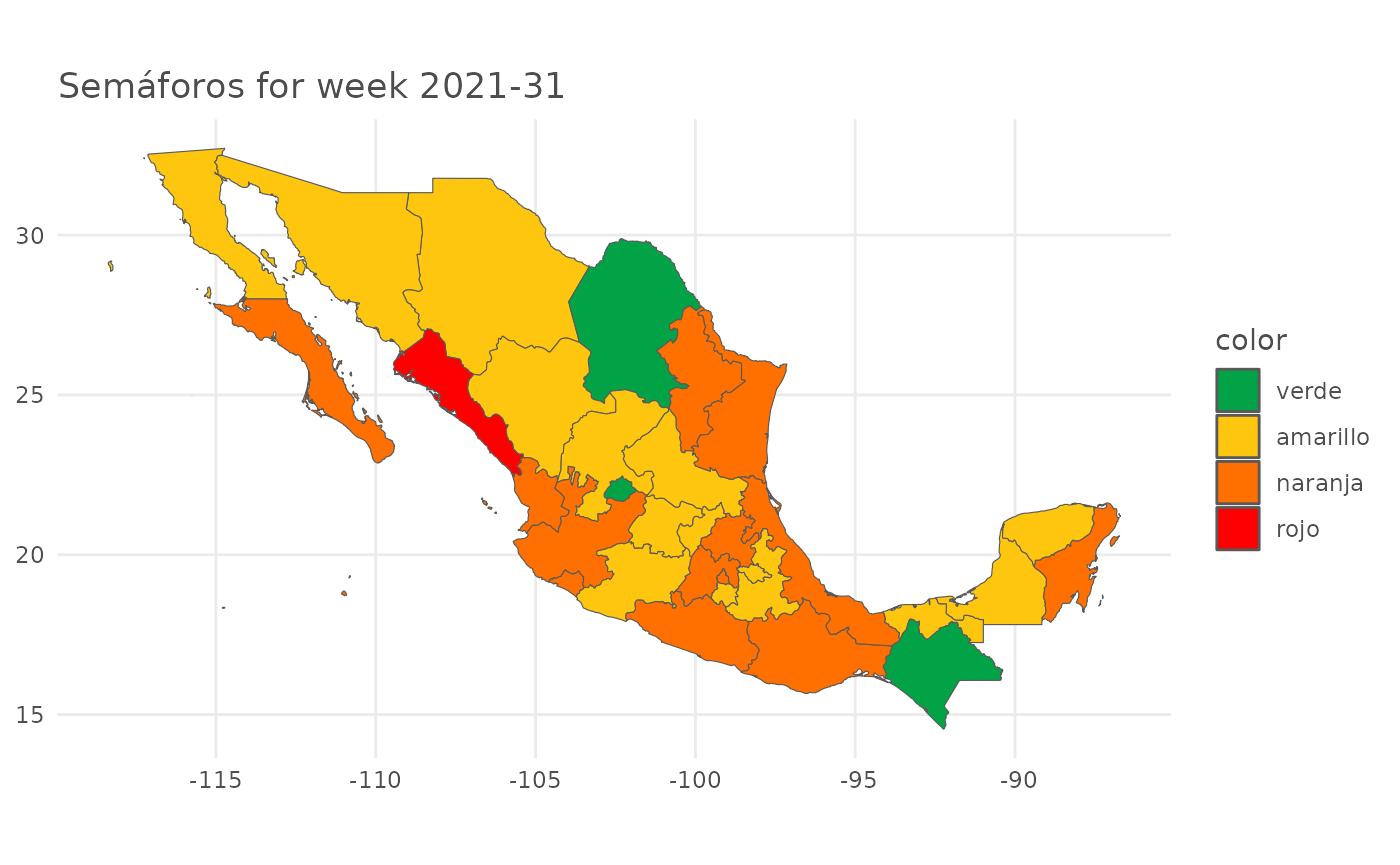
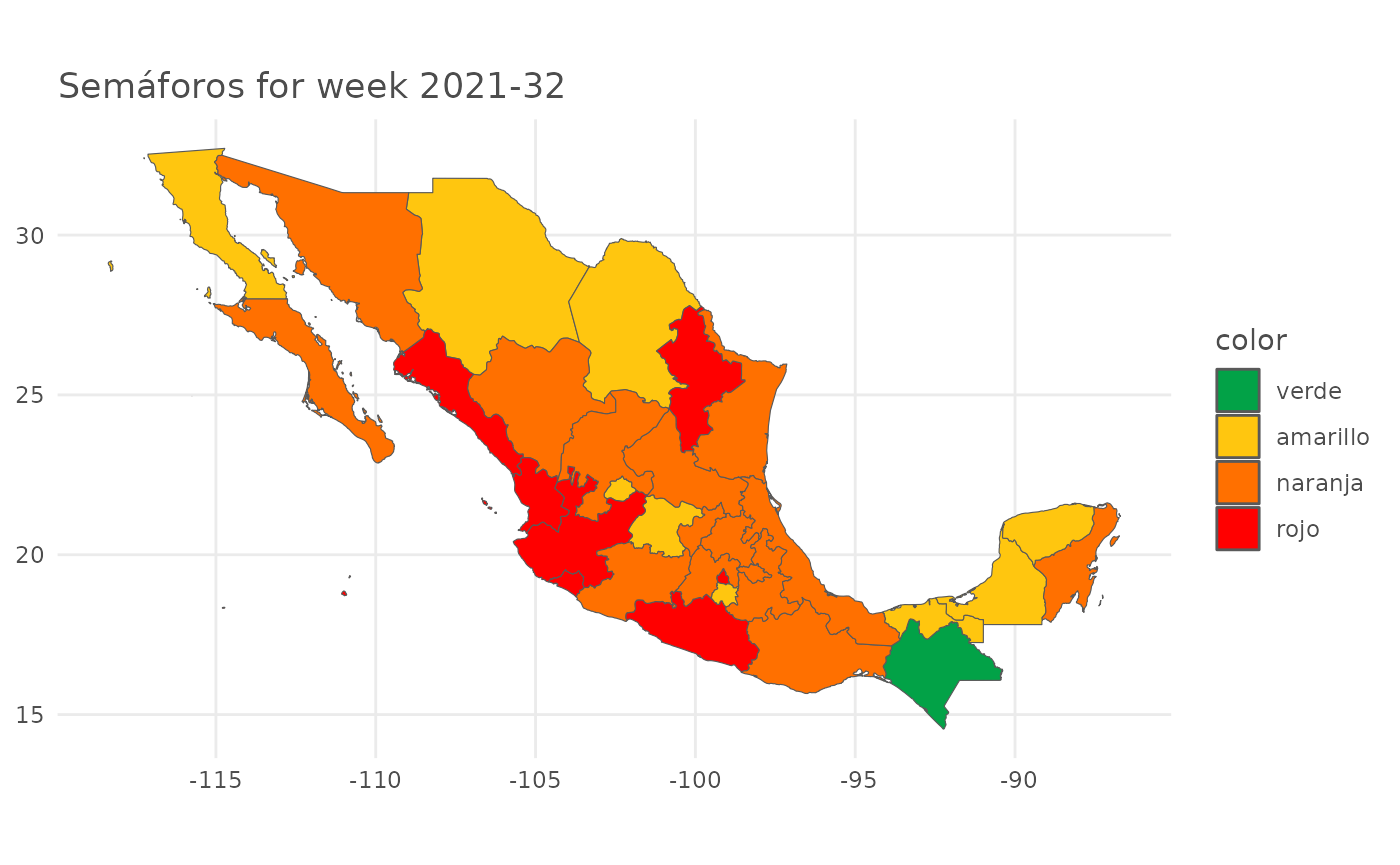
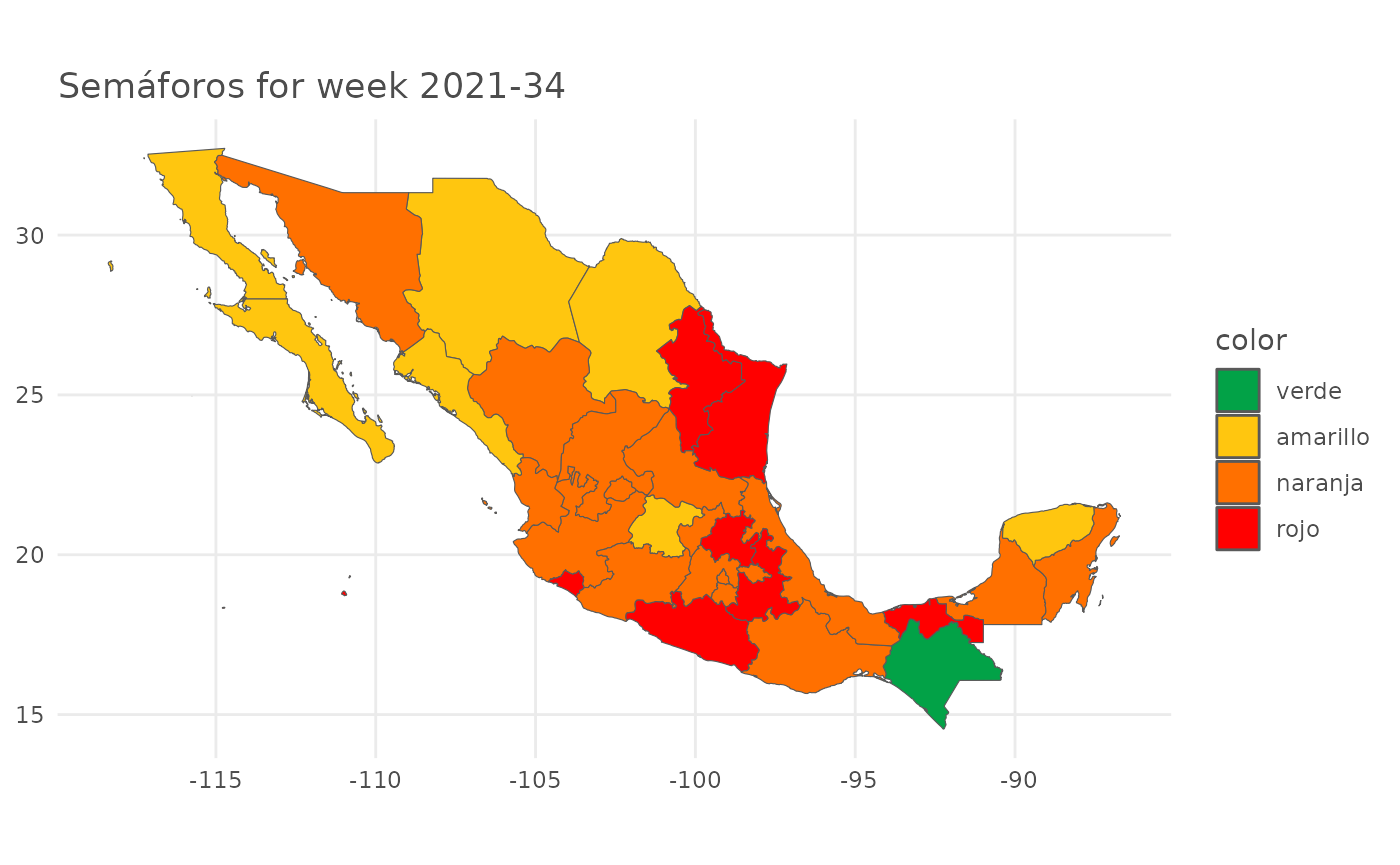
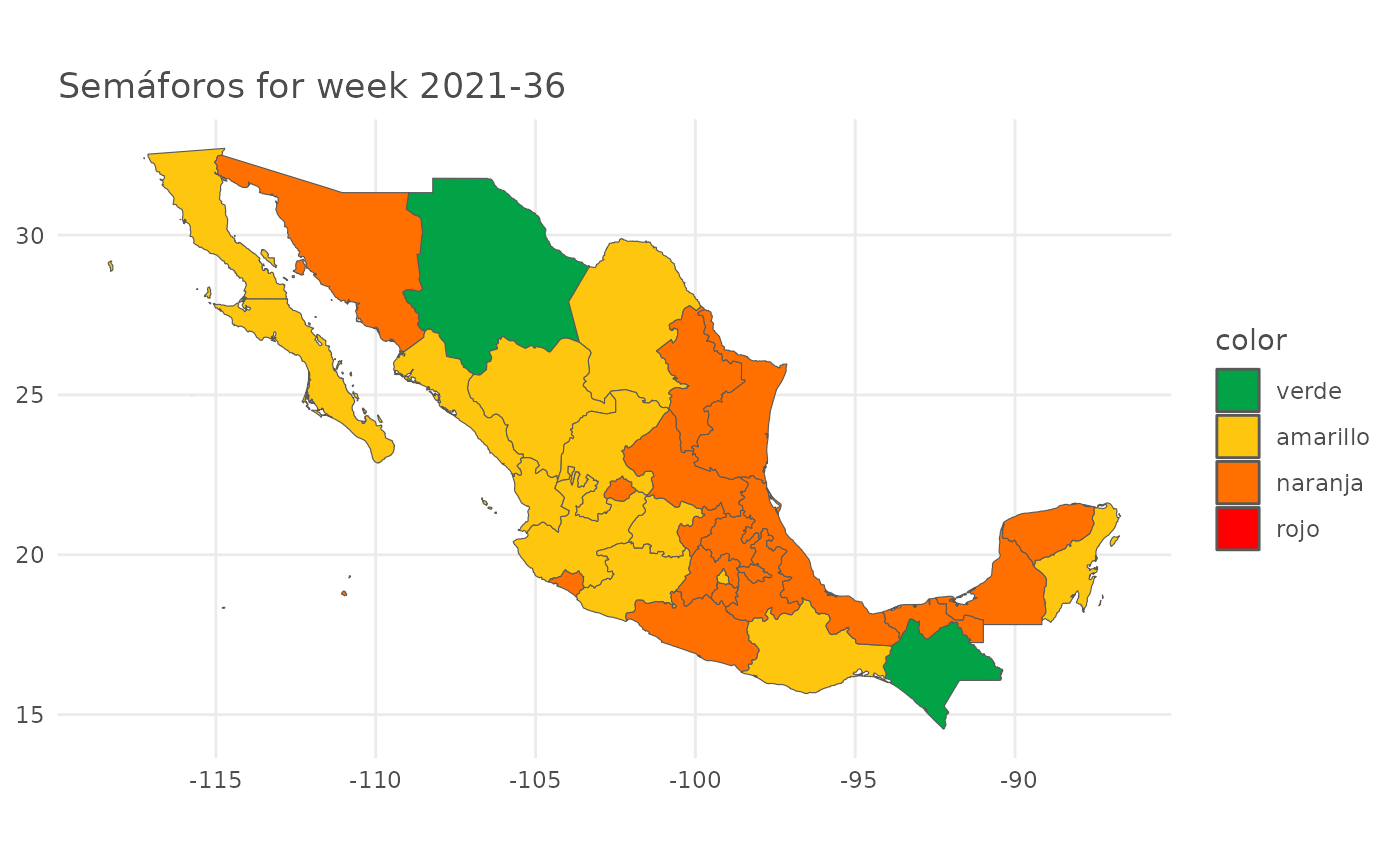
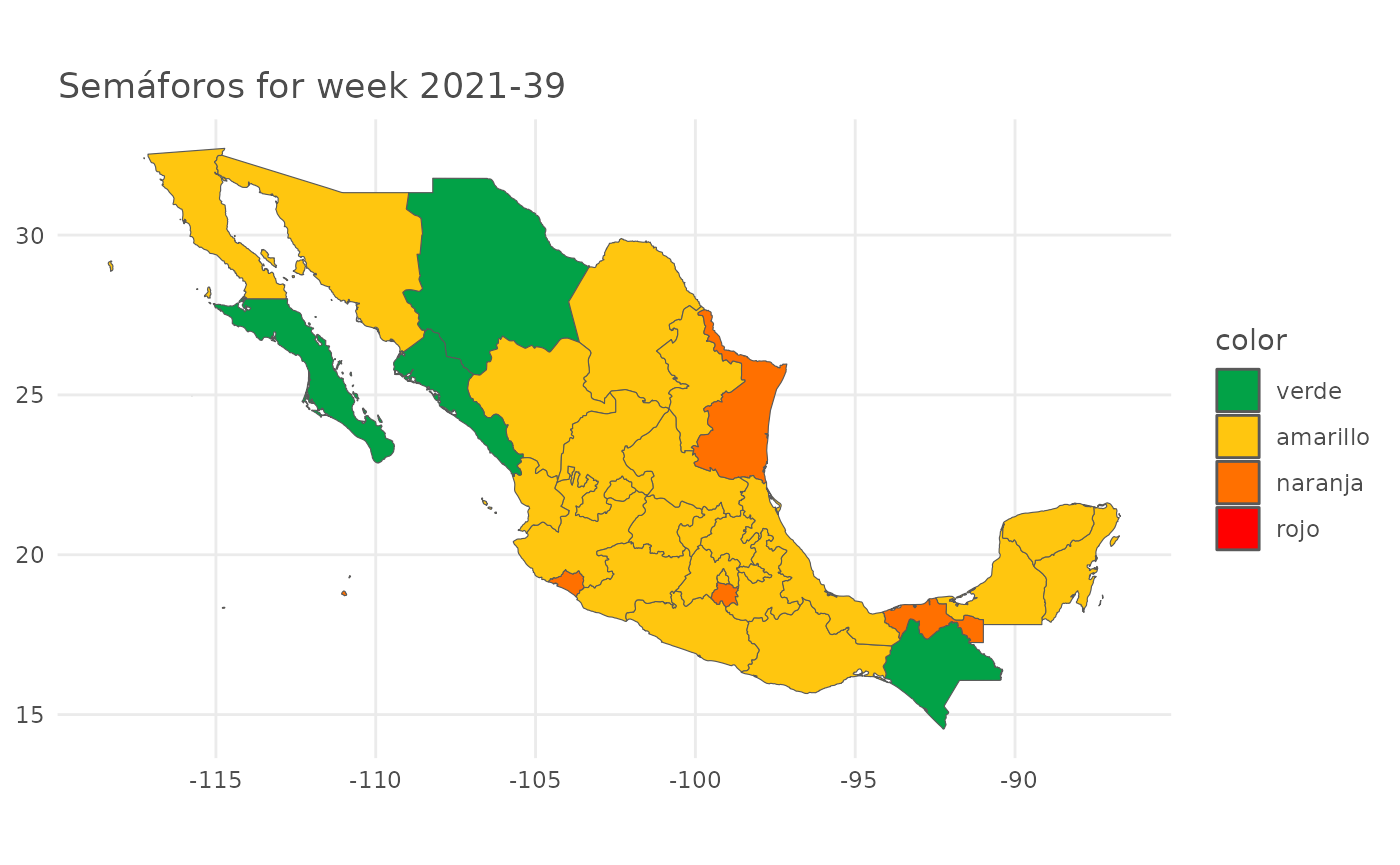
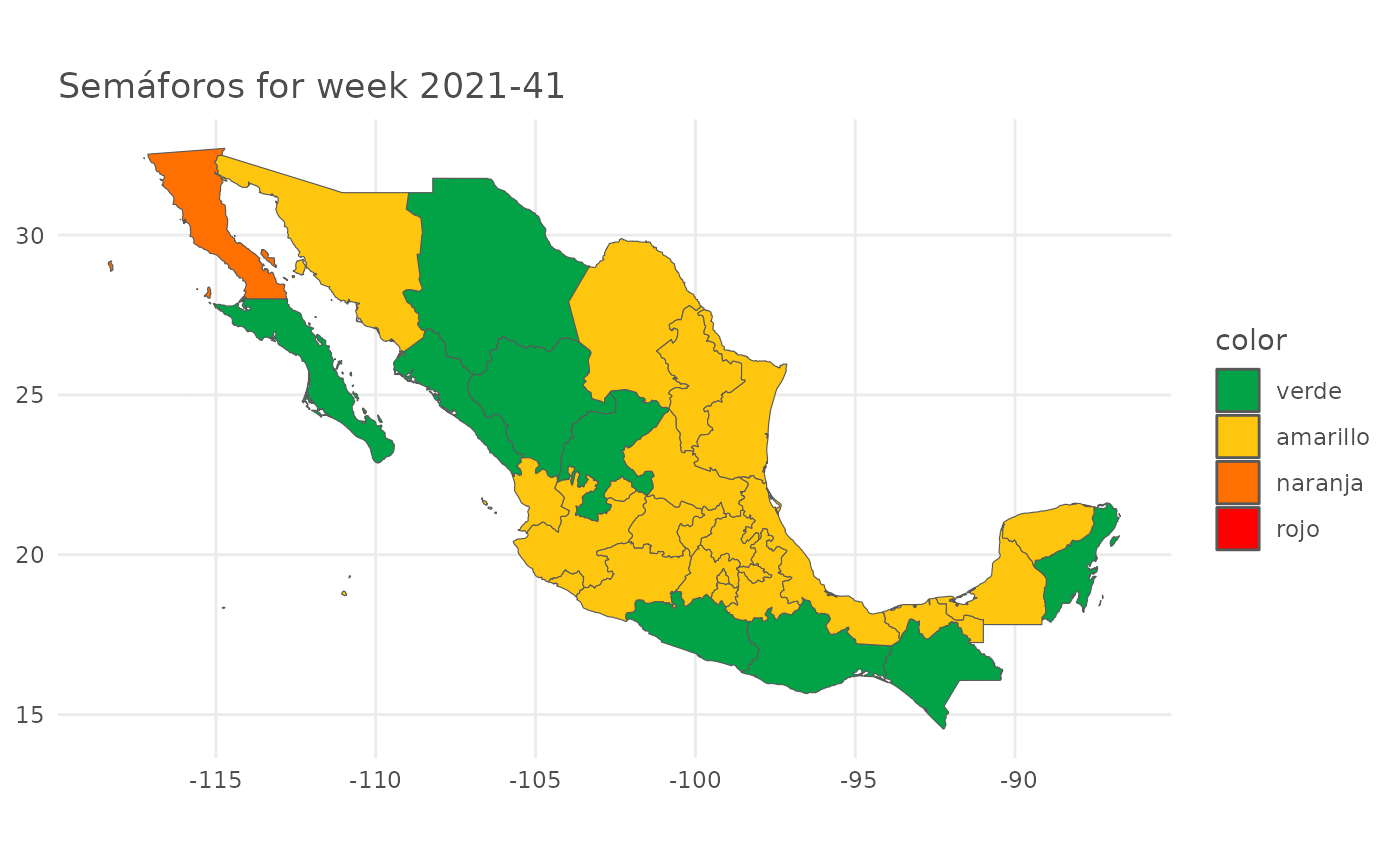
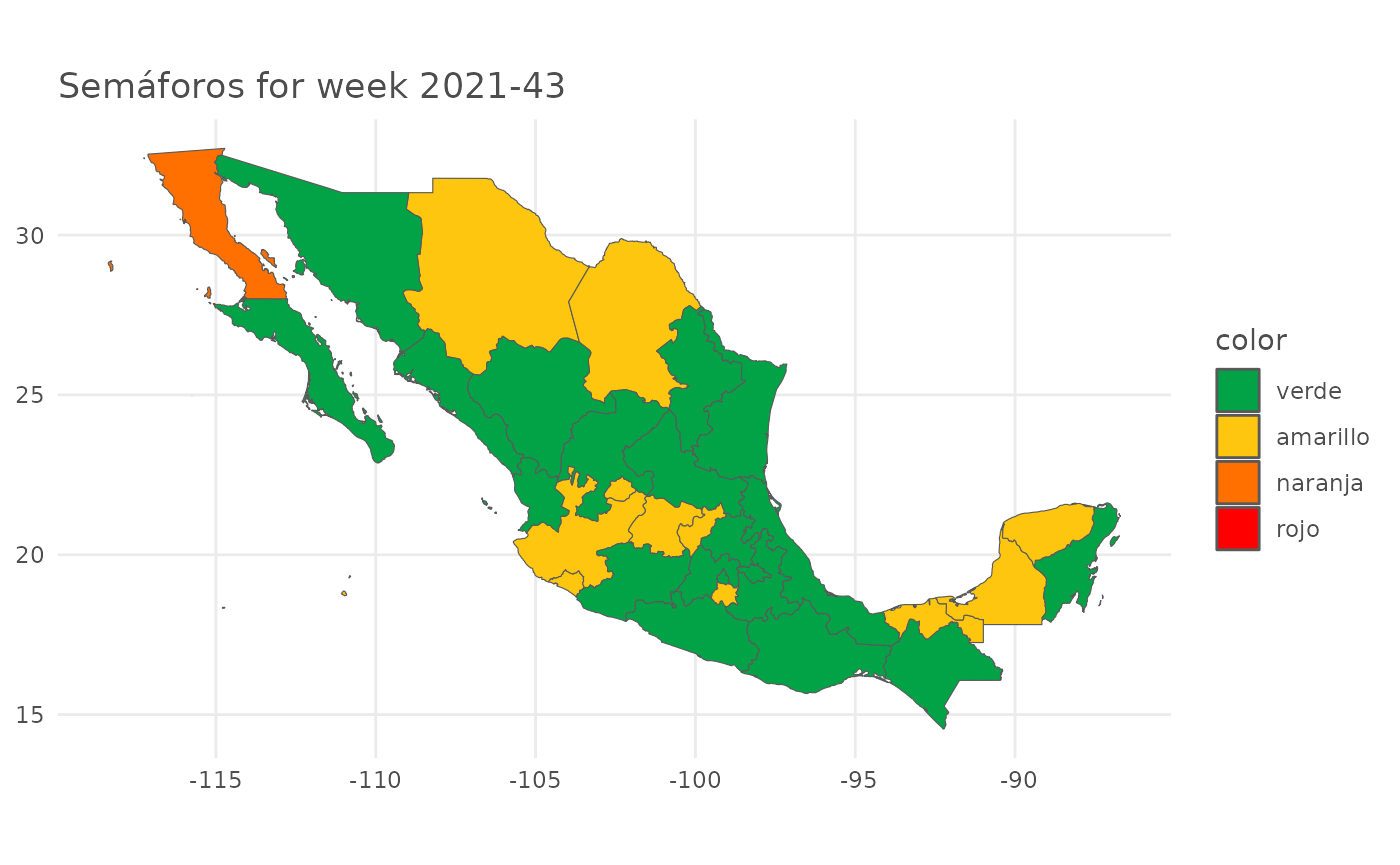
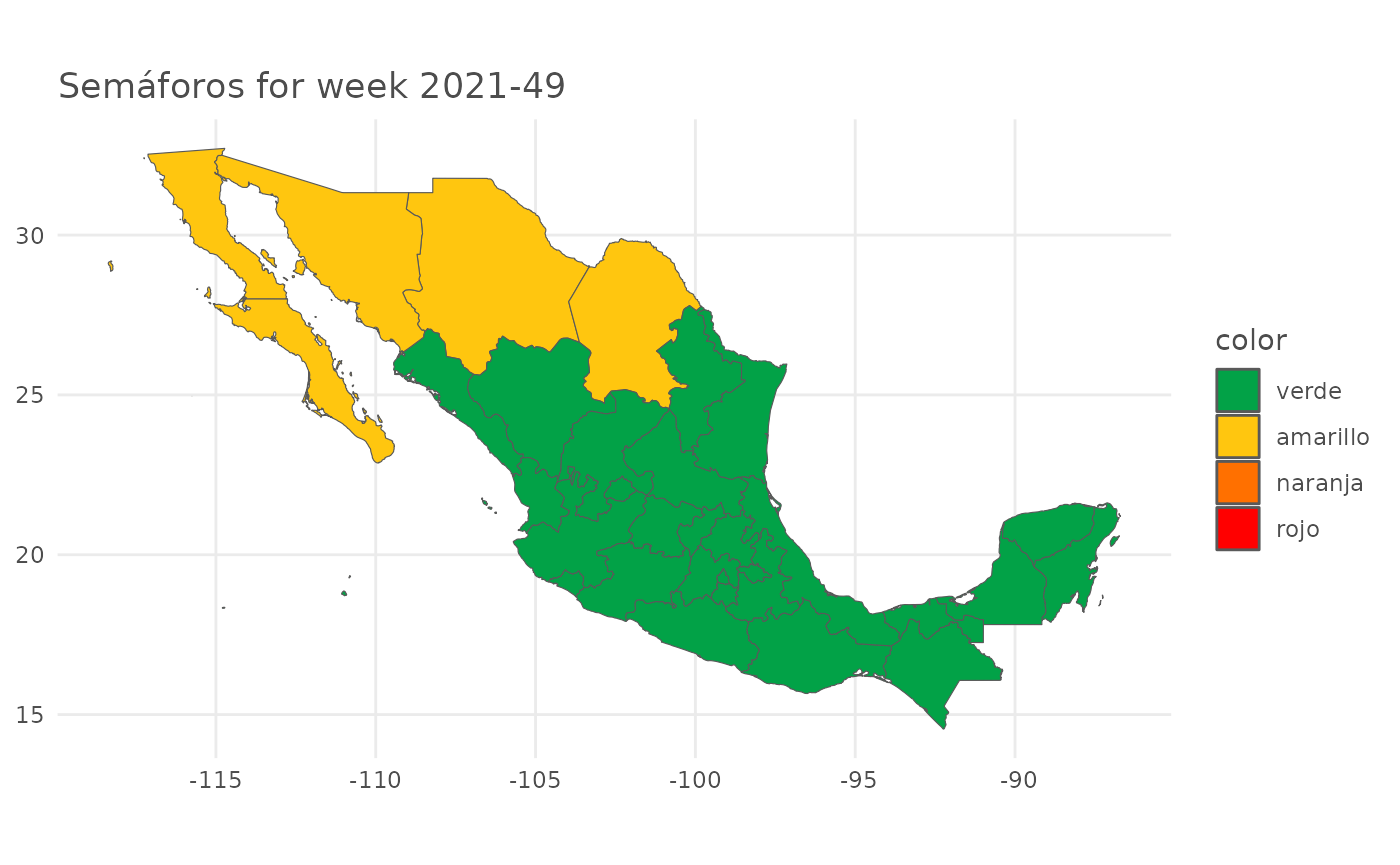
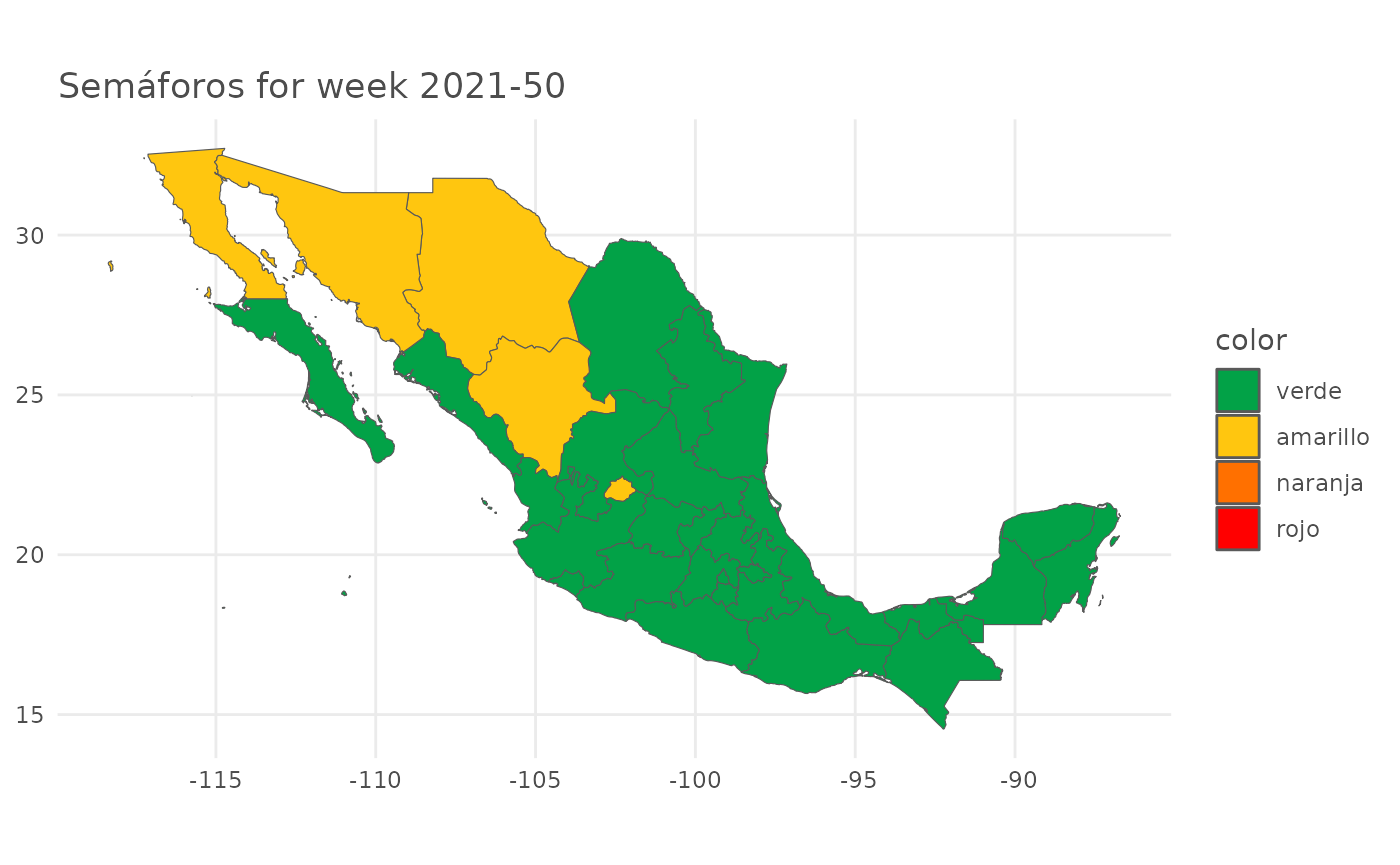
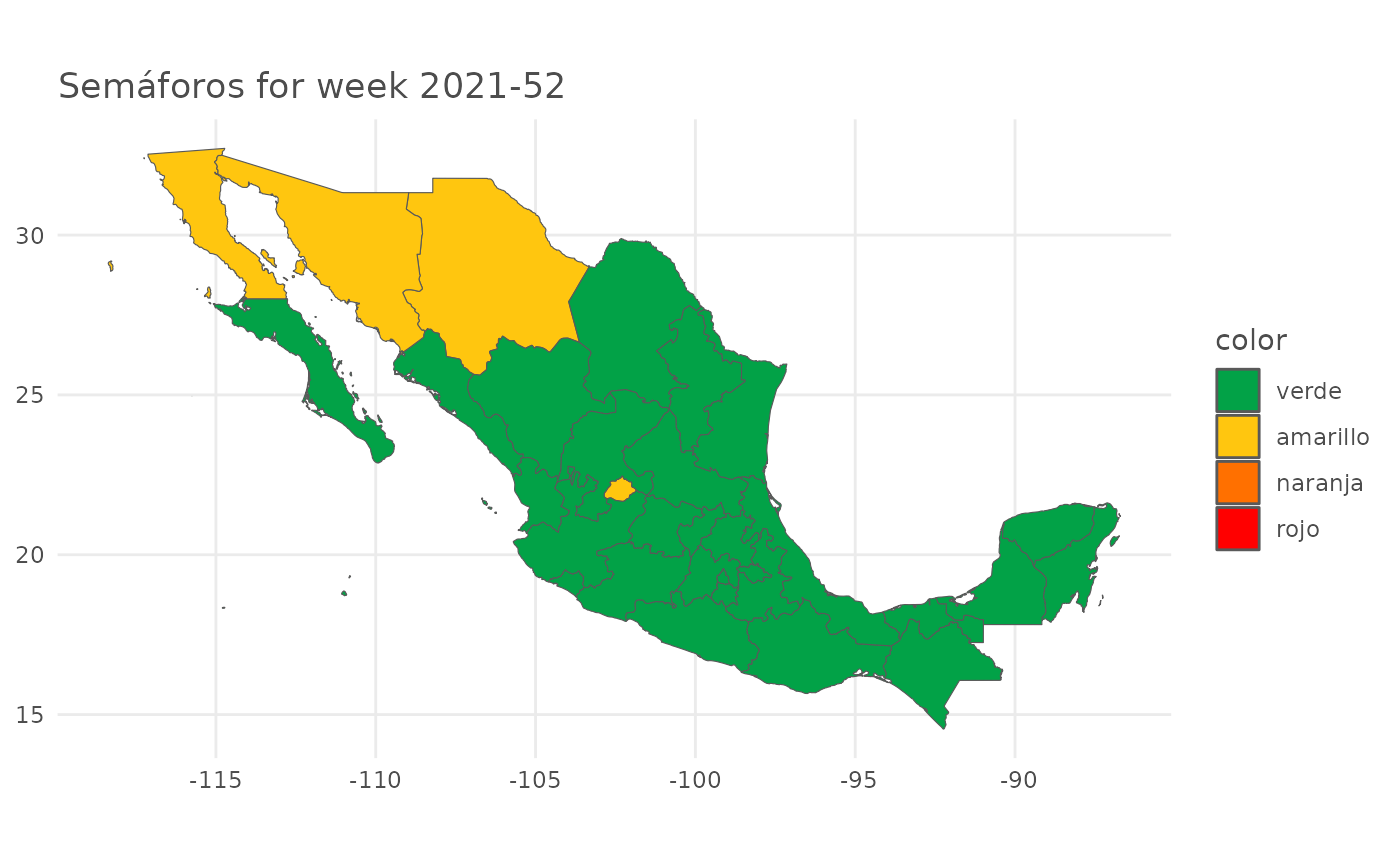
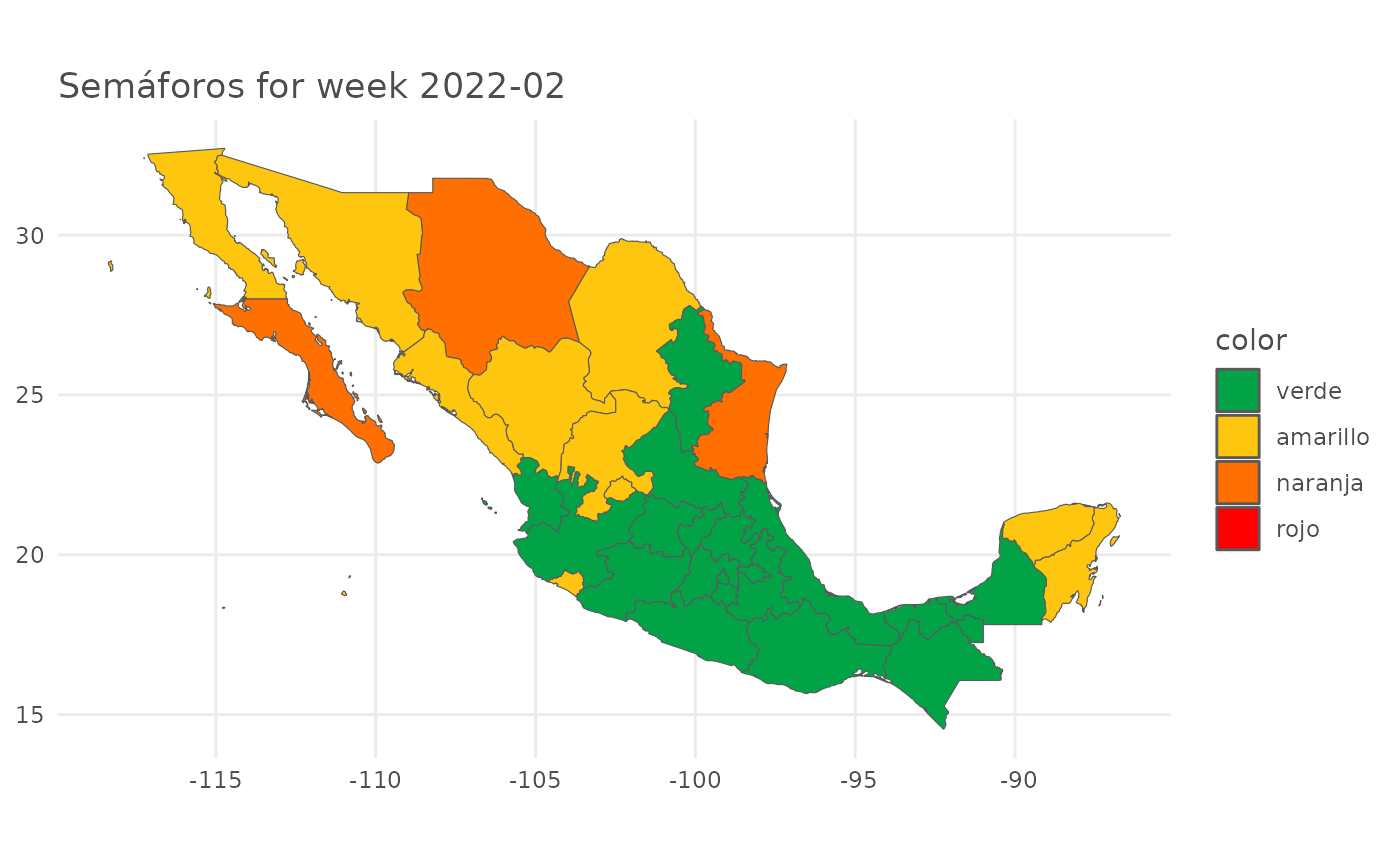
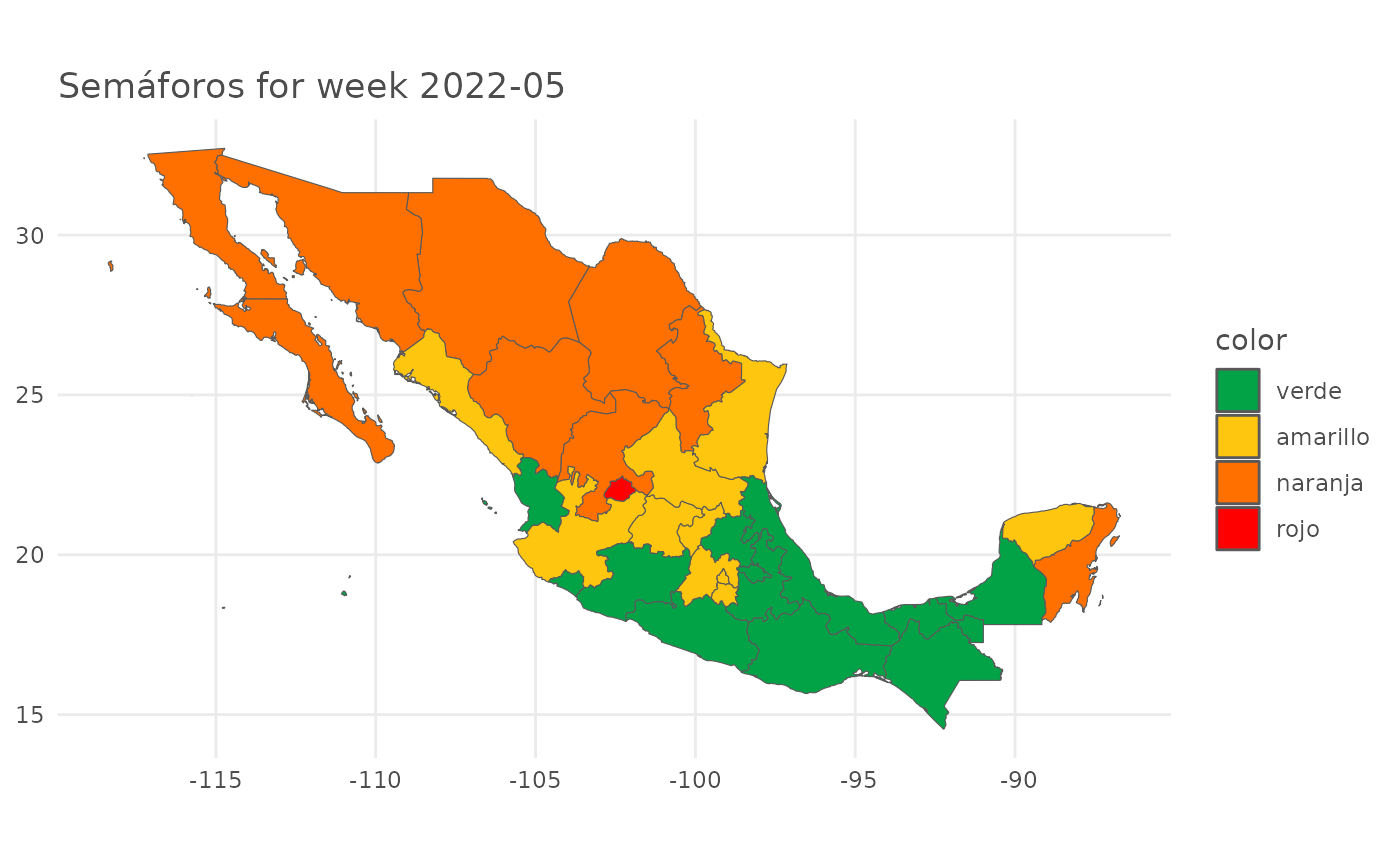
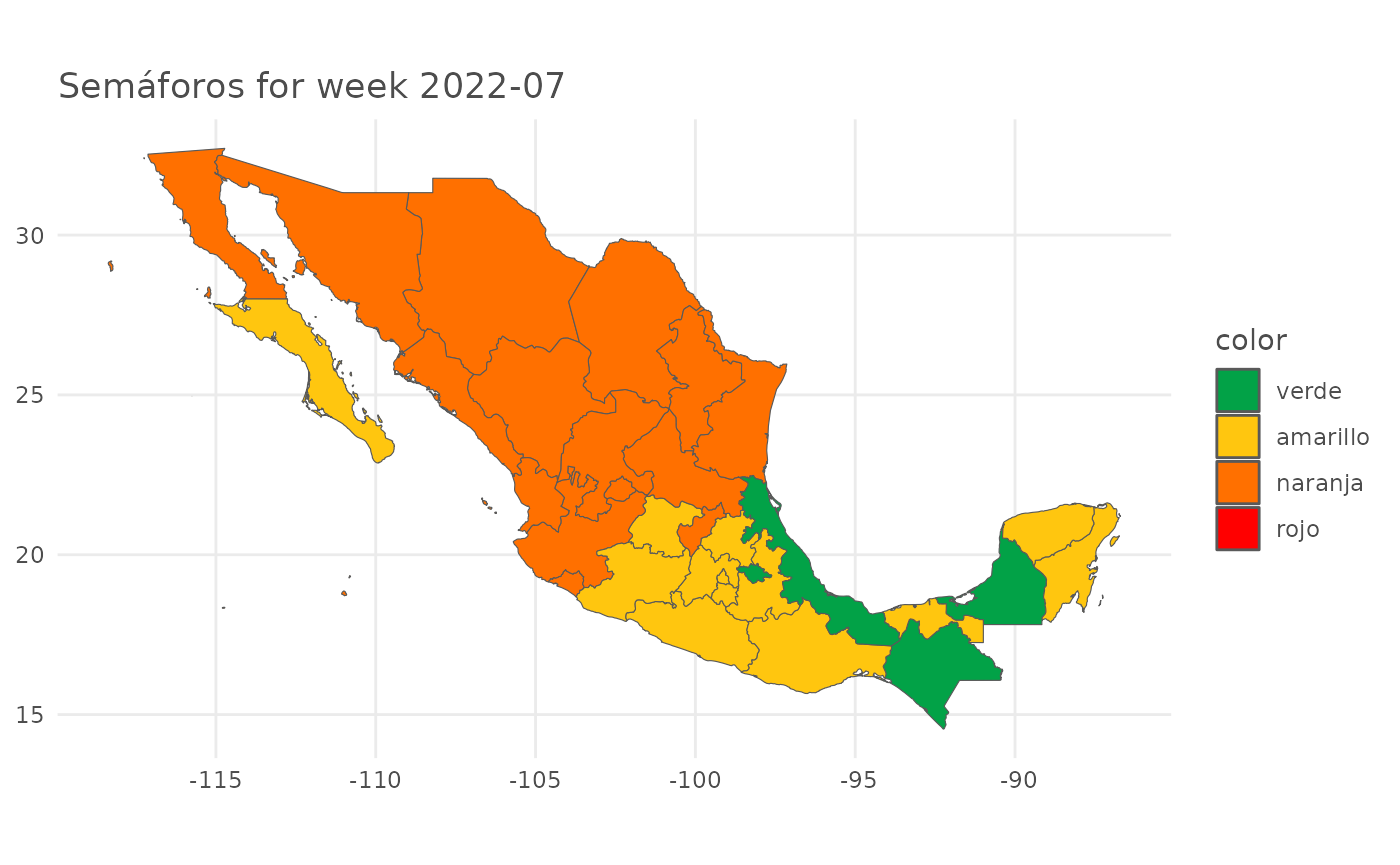
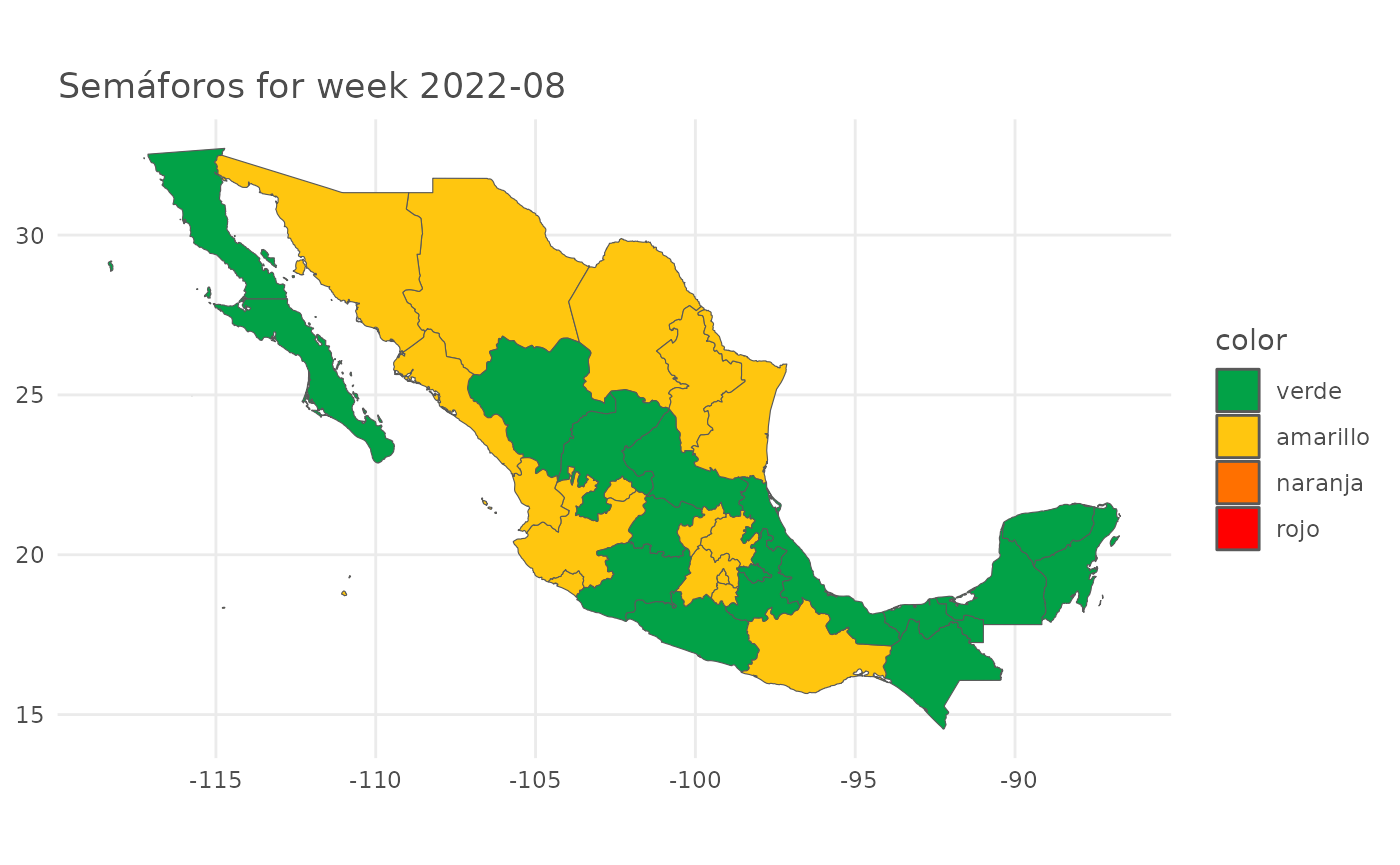
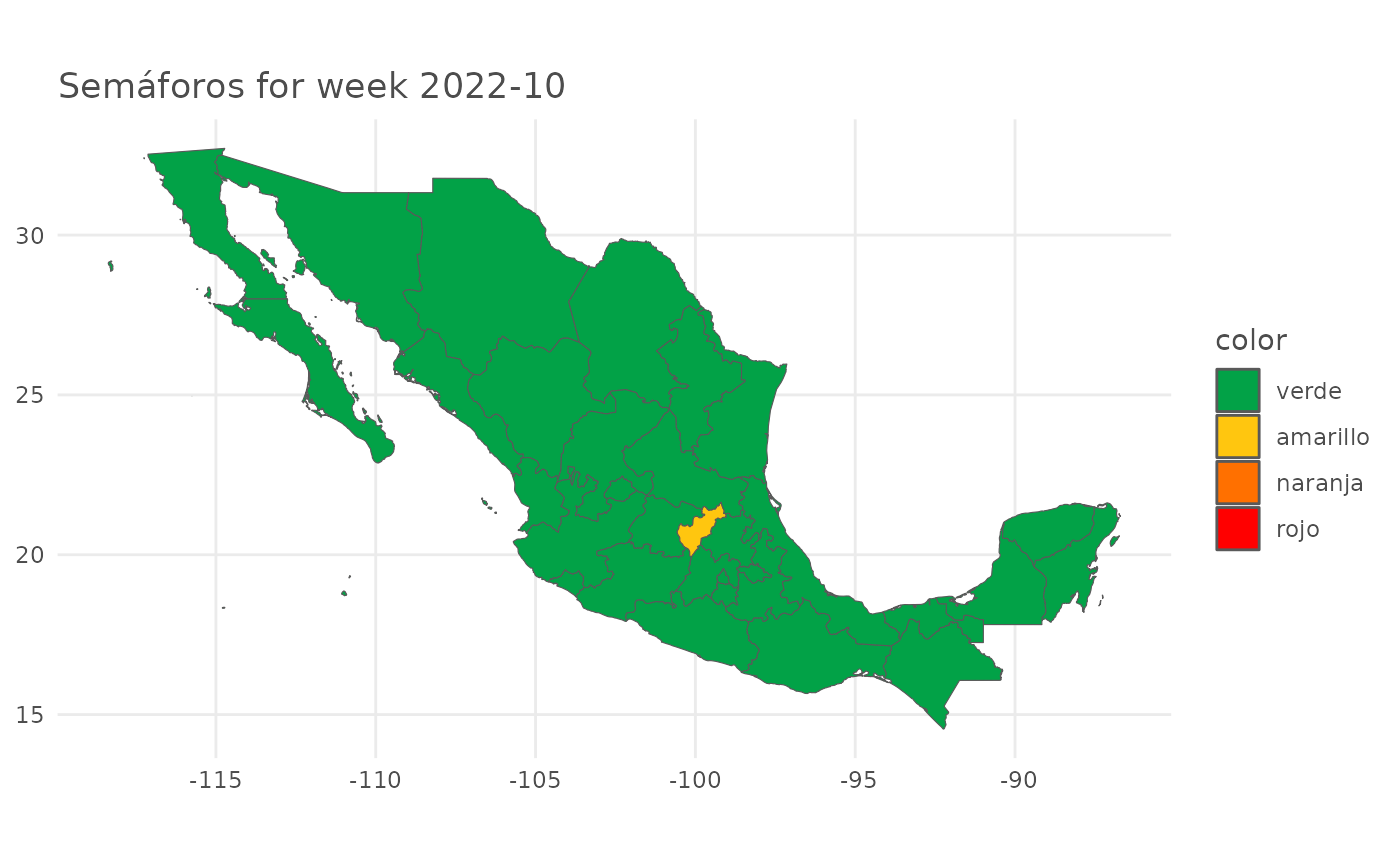
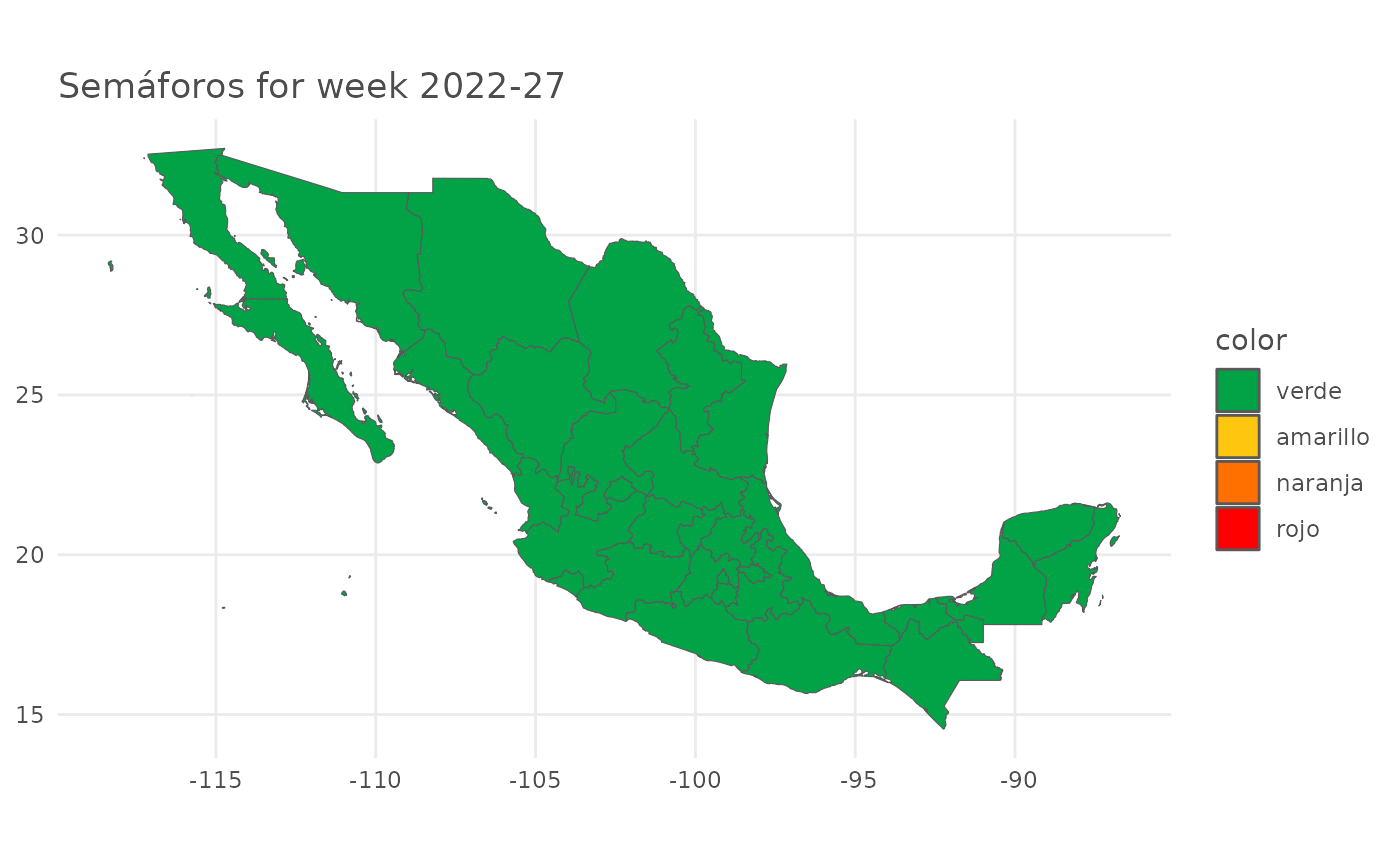
Map of semaforos over time
library(ggplot2)
library(sf)

mxstates <- readRDS(system.file("extdata", "sf_mx_estados.rds", package = "semaforos"))

df <- merge(mxstates, sl, by.x = "name", by.y = "estado", all = TRUE)
df$yearweek <- paste(df$year, df$week, sep = "-")

for (w in sort(unique(df$yearweek))) {
  print(
    ggplot(df[df$yearweek == w, ]) +
      geom_sf(aes(fill = color), size = 0.2) +
      coord_sf() +
      scale_fill_manual(
        values = c(verde = "#02A247", amarillo = "#FFC60F", naranja = "#FF7000", rojo = "#FF0000"),
        limits = c("verde", "amarillo", "naranja", "rojo")
      ) +
      theme_minimal() +
      theme(title = element_text(color = "grey30"), legend.text = element_text(color = "grey30")) +
      labs(title = paste("Semáforos for week", w))
  )
}


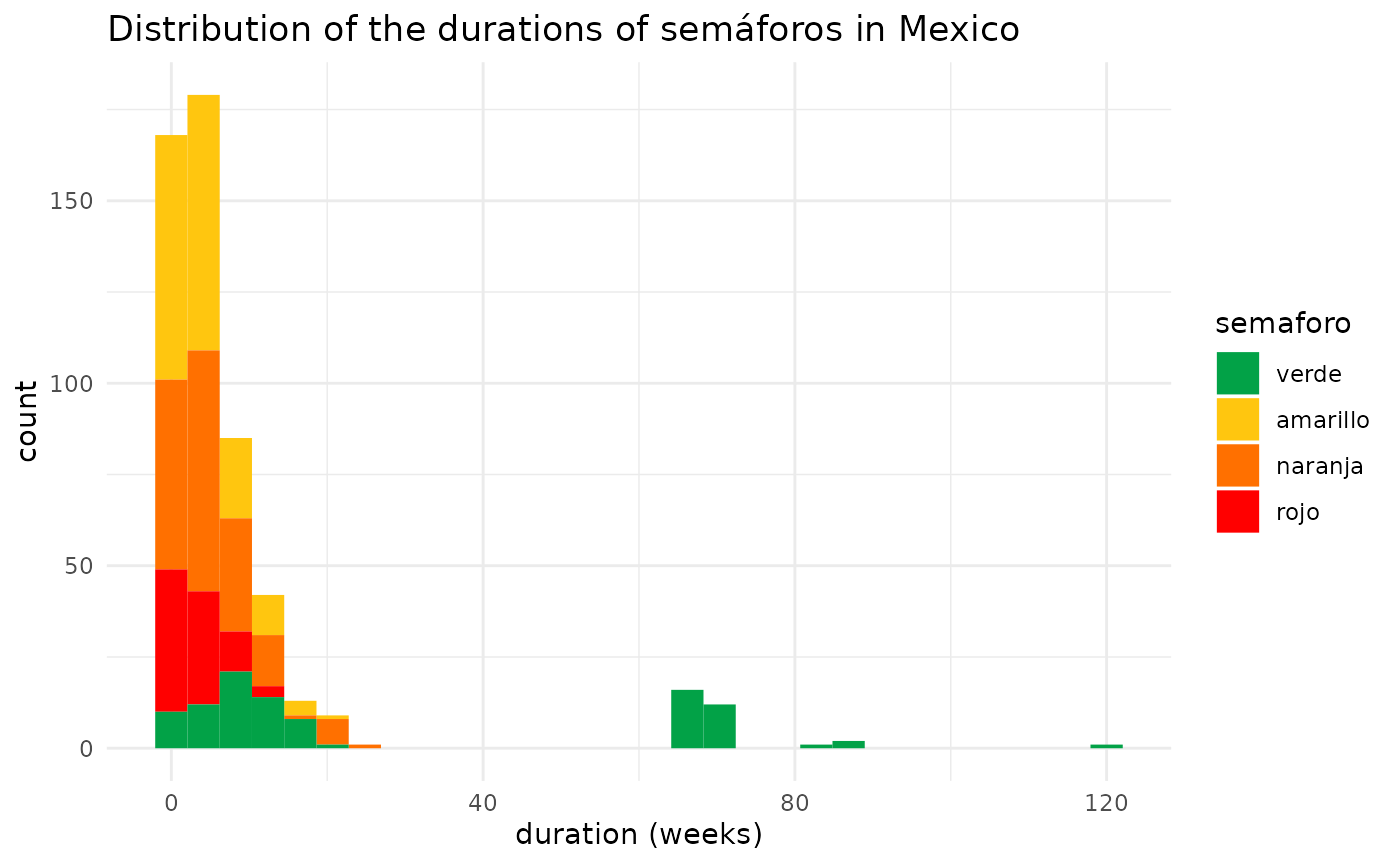
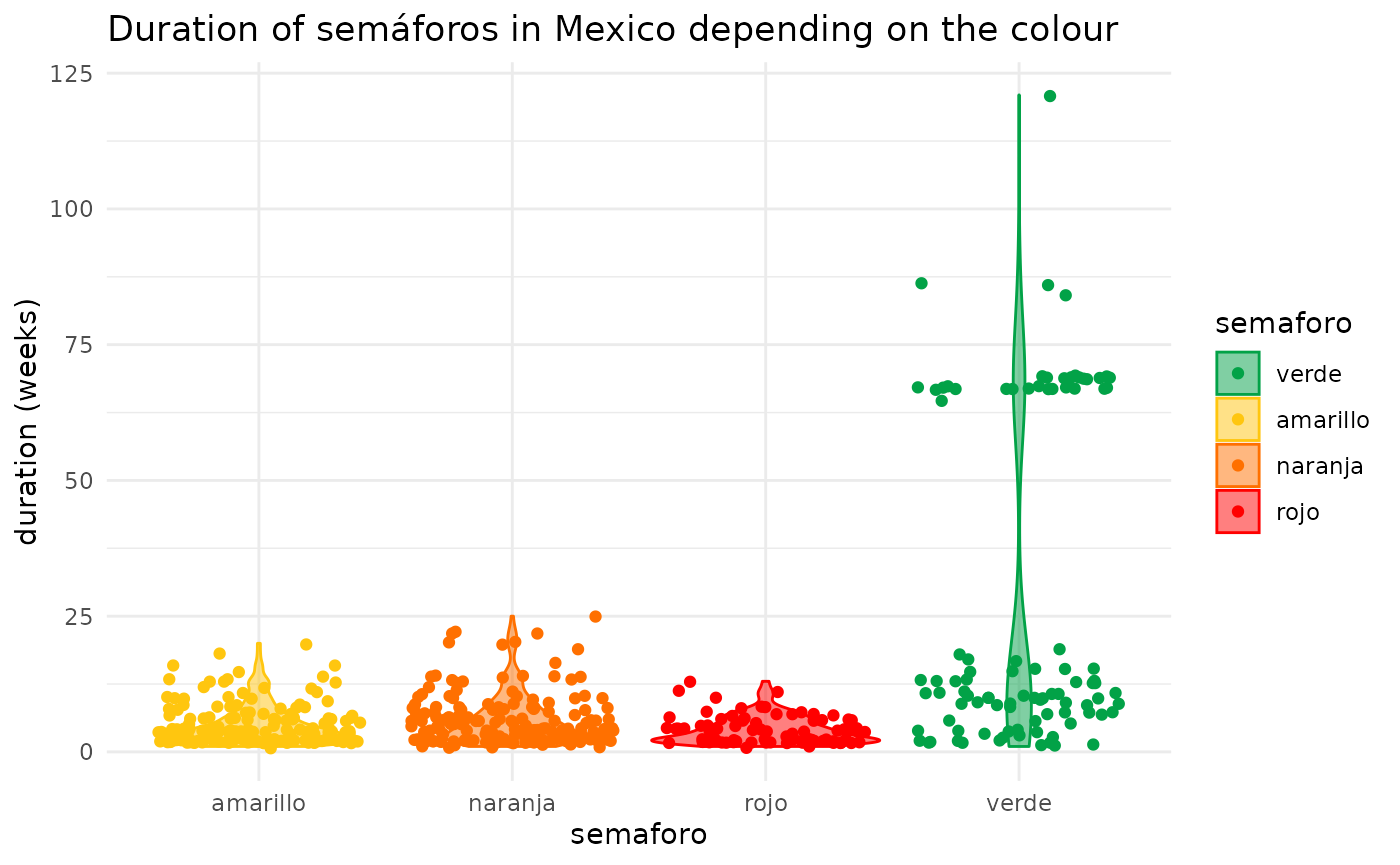
Duration of each semáforo
library(dplyr)
#>
#> Attaching package: 'dplyr'
#> The following objects are masked from 'package:stats':
#>
#>     filter, lag
#> The following objects are masked from 'package:base':
#>
#>     intersect, setdiff, setequal, union
library(ggplot2)

duration_sf <- sl %>%
  group_by(estado) %>%
  summarize(semaforo = rle(color)$values,
            duration = rle(color)$lengths)
#> Warning: Returning more (or less) than 1 row per `summarise()` group was deprecated in
#> dplyr 1.1.0.
#> ℹ Please use `reframe()` instead.
#> ℹ When switching from `summarise()` to `reframe()`, remember that `reframe()`
#>   always returns an ungrouped data frame and adjust accordingly.
#> Call `lifecycle::last_lifecycle_warnings()` to see where this warning was
#> generated.
#> `summarise()` has grouped output by 'estado'. You can override using the
#> `.groups` argument.
head(duration_sf)
#> # A tibble: 6 × 3
#> # Groups:   estado [1]
#>   estado         semaforo duration
#>   <chr>          <chr>       <int>
#> 1 Aguascalientes rojo            2
#> 2 Aguascalientes naranja         9
#> 3 Aguascalientes rojo            2
#> 4 Aguascalientes naranja         4
#> 5 Aguascalientes amarillo        2
#> 6 Aguascalientes naranja        12

ggplot(duration_sf, aes(x = duration, fill = semaforo)) +
  geom_histogram() +
  scale_fill_manual(
    values = c(verde = "#02A247", amarillo = "#FFC60F", naranja = "#FF7000", rojo = "#FF0000"),
    limits = c("verde", "amarillo", "naranja", "rojo")
  ) +
  labs(x = "duration (weeks)",
       title = "Distribution of the durations of semáforos in Mexico") +
  theme_minimal()
#> `stat_bin()` using `bins = 30`. Pick better value with `binwidth`.

ggplot(duration_sf, aes(x = semaforo, y = duration, fill = semaforo, color = semaforo)) +
  geom_violin(alpha = 0.5) +
  geom_jitter() +
  scale_fill_manual(
    values = c(verde = "#02A247", amarillo = "#FFC60F", naranja = "#FF7000", rojo = "#FF0000"),
    limits = c("verde", "amarillo", "naranja", "rojo")
  ) +
  scale_colour_manual(
    values = c(verde = "#02A247", amarillo = "#FFC60F", naranja = "#FF7000", rojo = "#FF0000"),
    limits = c("verde", "amarillo", "naranja", "rojo")
  ) +
  labs(y = "duration (weeks)",
       title = "Duration of semáforos in Mexico depending on the colour") +
  theme_minimal()
Time spent in each colour
library(dplyr)
library(forcats)

sl %>%
  count(color, estado) %>%
  ggplot(aes(x = n, y = estado, fill = fct_relevel(color, "verde"))) +
    geom_histogram(stat = "identity") +
    scale_fill_manual(
      values = c(verde = "#02A247", amarillo = "#FFC60F", naranja = "#FF7000", rojo = "#FF0000"),
      limits = c("verde", "amarillo", "naranja", "rojo"),
      name = "color"
    ) +
    theme_minimal() +
    labs(x = "total number of weeks on this colour")
#> Warning in geom_histogram(stat = "identity"): Ignoring unknown
#> parameters: `binwidth`, `bins`, and `pad`