Estimate asymptomatic cases in Italy during the COVID-19 pandemic
Source:vignettes/example.Rmd
example.RmdLet’s start by loading the example data. It’s bundled in the package but originally comes from https://github.com/GoogleCloudPlatform/covid-19-open-data (Apache License 2.0).
df <- readRDS(system.file("extdata", "covid19_italy.rds", package = "asymptor"))
head(df)
#>         date new_cases new_deaths
#> 1 2020-01-02         0          0
#> 2 2020-01-03         0          0
#> 3 2020-01-04         0          0
#> 4 2020-01-05         0          0
#> 5 2020-01-06         0          0
#> 6 2020-01-07         0          0
We can feed this data directly to the estimate_asympto() function. This function requires 3 columns, labelled as date, new_cases, new_deaths, containing the daily counts (not the cumulated total!)
asy <- estimate_asympto(df$date, df$new_cases, df$new_deaths)
head(asy)
#>         date lower upper
#> 1 2020-01-02    NA    NA
#> 2 2020-01-03     0    NA
#> 3 2020-01-04     0    NA
#> 4 2020-01-05     0    NA
#> 5 2020-01-06     0    NA
#> 6 2020-01-07     0    NA
We may want to visualise these estimations alongside the empirical data. So, we start by merging the two datasets:
res <- merge(df, asy)
head(res)
#>         date new_cases new_deaths lower upper
#> 1 2020-01-02         0          0    NA    NA
#> 2 2020-01-03         0          0     0    NA
#> 3 2020-01-04         0          0     0    NA
#> 4 2020-01-05         0          0     0    NA
#> 5 2020-01-06         0          0     0    NA
#> 6 2020-01-07         0          0     0    NA
Alternatively, we can directly use a tidyverse-compatible syntax:
library(dplyr)
res <- df %>%
  mutate(lower = estimate_asympto(date, new_cases, new_deaths, "lower")$lower,
         upper = estimate_asympto(date, new_cases, new_deaths, "upper")$upper)
head(res)
#>         date new_cases new_deaths lower upper
#> 1 2020-01-02         0          0    NA    NA
#> 2 2020-01-03         0          0     0    NA
#> 3 2020-01-04         0          0     0    NA
#> 4 2020-01-05         0          0     0    NA
#> 5 2020-01-06         0          0     0    NA
#> 6 2020-01-07         0          0     0    NA
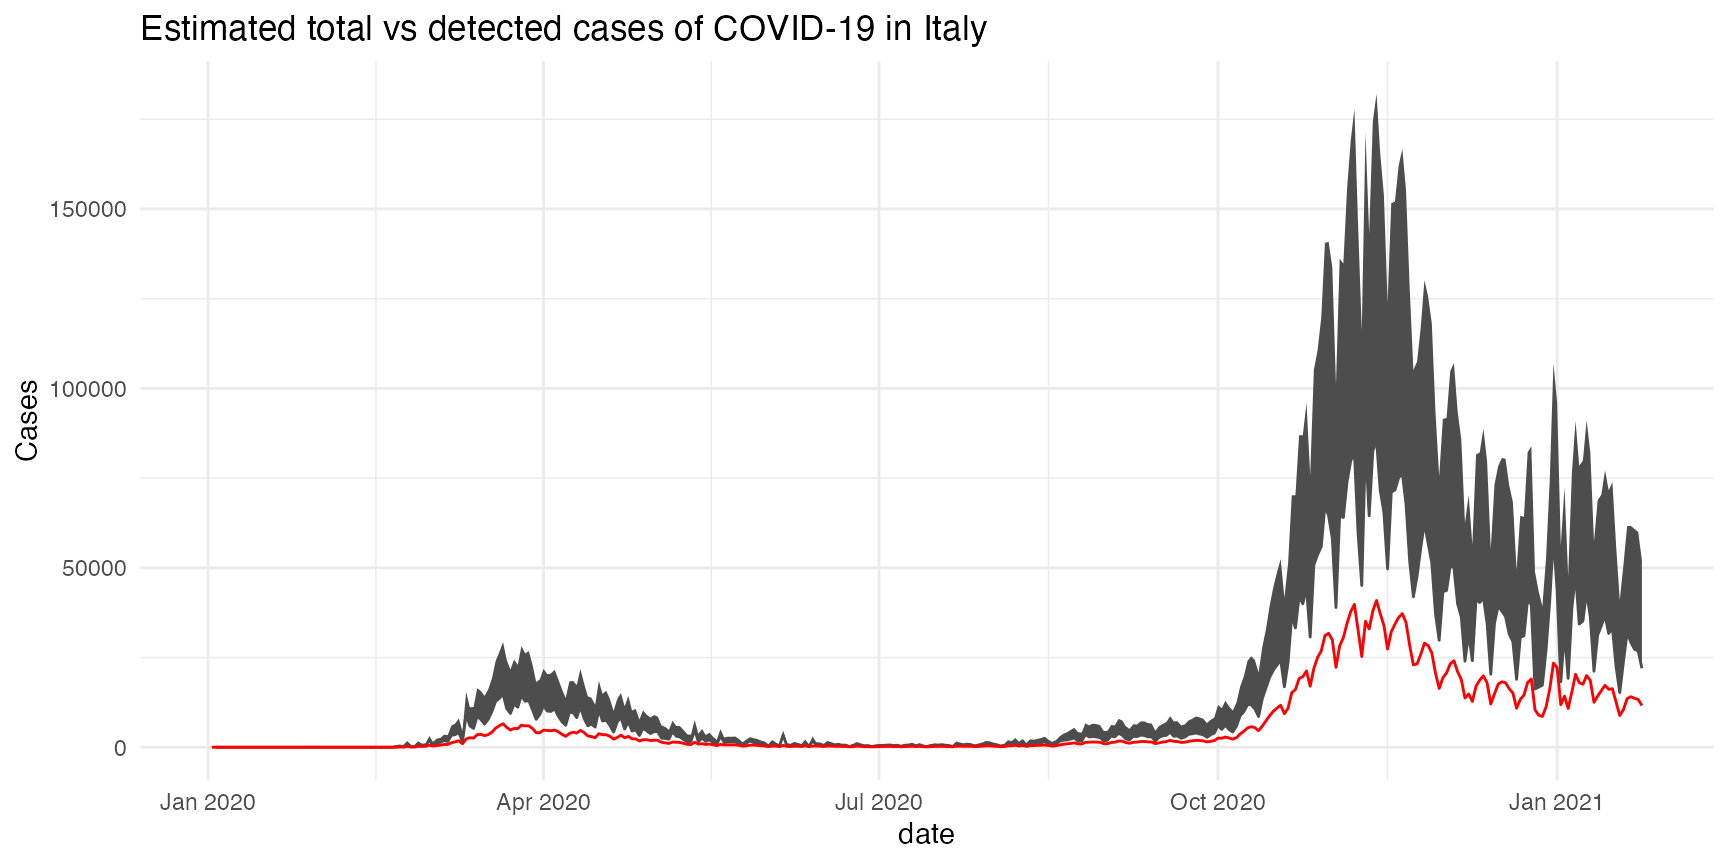
Then, we can the ggplot2 package to plot the result:
library(ggplot2)
ggplot(res, aes(x = date)) +
  geom_line(aes(y = new_cases+lower), col = "grey30") +
  geom_ribbon(aes(ymin = new_cases+lower,
                  ymax = new_cases+upper),
              fill = "grey30") +
  geom_line(aes(y = new_cases), color = "red") +
  labs(title = "Estimated total vs detected cases of COVID-19 in Italy",
       y = "Cases") +
  theme_minimal()
#> Warning: Removed 1 row(s) containing missing values (geom_path).